Healthcare Practitioners and Technical Workers, All Other in Ohio
Considering working as a Healthcare Practitioners and Technical Workers, All Other in Ohio? Below are the key facts. All healthcare practitioners and technical workers not listed separately.
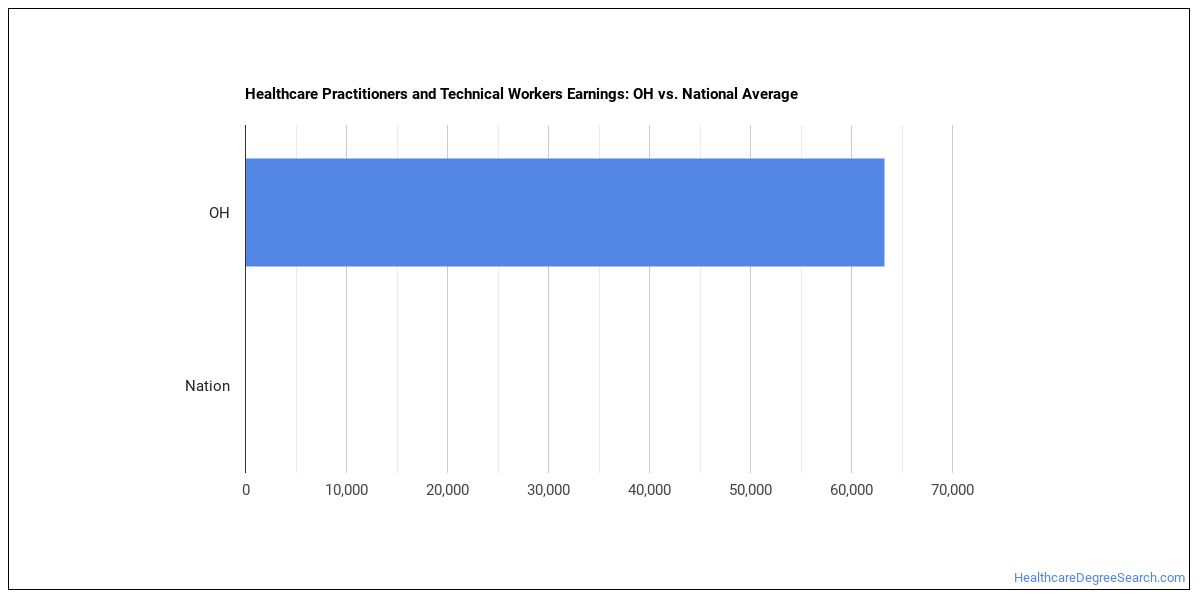
What do Healthcare Practitioners and Technical Workers, All Other Make in Ohio?
For a healthcare practitioners and technical workers, all other working in Ohio, the typical annual salary is $62,530 per year (or roughly $30.06/hour).Earnings range from $36,880 at the 10th percentile to $119,810 at the 90th percentile.
| Wage Statistic | Annual | Hourly |
|---|---|---|
| 10th percentile | $36,880 | $17.73 |
| 25th percentile | $46,540 | $22.37 |
| Median (50th) | $62,530 | $30.06 |
| 75th percentile | $93,600 | $45.00 |
| 90th percentile | $119,810 | $57.60 |

The location quotient — a measure of how concentrated this occupation is in Ohio relative to the national average — is 0.38, indicating fewer healthcare practitioners and technical workers, all other per worker than the national average.
National Wage Comparison
Nationally, healthcare practitioners and technical workers, all other earn a median of $117,846 per year ($56.66/hour), lower than the Ohio median.
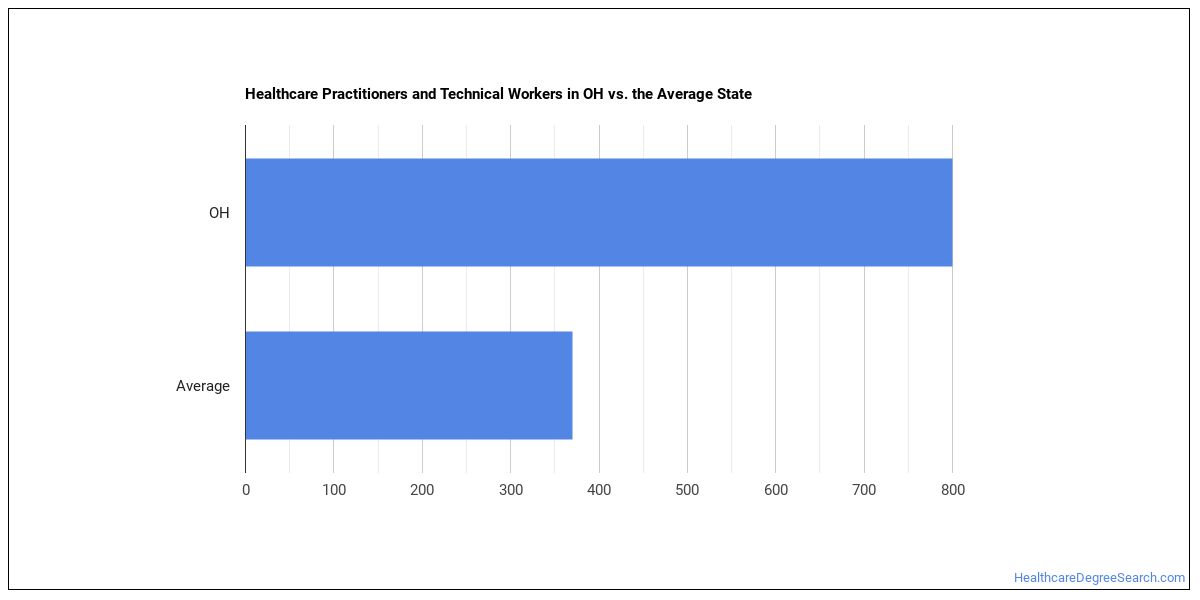
Employment Outlook
There are roughly 1,850,208 healthcare practitioners and technical workers, all other nationwide. In Ohio alone, approximately 500 people work in this role. That puts the state above the typical state, which employs around 490 healthcare practitioners and technical workers, all other.

Top Ohio Metros for Healthcare Practitioners and Technical Workers, All Other
The largest metro-area employers of healthcare practitioners and technical workers, all other in Ohio.
| Metro Area | Number Employed | Annual Median Salary |
|---|---|---|
| Cincinnati, OH-KY-IN | 140 | $64,710 |
| Cleveland, OH | 110 | $58,230 |
| Columbus, OH | 80 | $63,310 |
| Dayton-Kettering-Beavercreek, OH | 60 | $60,030 |
| Toledo, OH | 30 | $77,500 |
Top States for Healthcare Practitioners and Technical Workers, All Other Employment
The table below shows the states where the most healthcare practitioners and technical workers, all other work.
| State | Number Employed |
|---|---|
| California | 4,110 |
| Louisiana | 3,820 |
| Pennsylvania | 2,740 |
| Maryland | 2,650 |
| Tennessee | 2,090 |
| Texas | 1,640 |
| Florida | 1,610 |
| Georgia | 1,360 |
| New York | 1,290 |
| Nevada | 1,040 |
| Michigan | 1,020 |
| New Jersey | 880 |
| North Carolina | 850 |
| Washington | 820 |
| Hawaii | 800 |
| Indiana | 720 |
| Illinois | 710 |
| Connecticut | 570 |
| Arizona | 560 |
| Arkansas | 540 |
Highest-Paying States for Healthcare Practitioners and Technical Workers, All Other
Where healthcare practitioners and technical workers, all other earn the most: healthcare practitioners and technical workers, all other.
| State | Annual Median Salary |
|---|---|
| District of Columbia | $107,490 |
| Puerto Rico | $107,240 |
| Indiana | $87,870 |
| New York | $84,050 |
| Wisconsin | $78,790 |
| Kentucky | $78,610 |
| Minnesota | $78,300 |
| New Hampshire | $77,310 |
| Michigan | $76,530 |
| Virginia | $76,450 |
What Major Will Prepare You For This Career?
Several college majors map to this occupation:
- Health/Medical Admin Services
- Bioethics/Medical Ethics
- Alternative Medicine & Systems
- Energy & Bio-Based Therapies
Featured schools near , edit
Also Known As
Central Supply Technician, Child Health Associate, Drug Coordinator, Extracorporeal Technician, Health Service Coordinator, Kinesiologist, Medical Consultant, Pheresis Specialist, Podiatric Technician, Traditional Chinese Herbalist, Transplant Coordinator, Utilization Review Coordinator.
References
- U.S. Bureau of Labor Statistics, Occupational Employment and Wage Statistics — https://www.bls.gov/oes/
- O*NET Online — https://www.onetonline.org/
- BLS Employment Projections — https://www.bls.gov/emp/
- O*NET-SOC code: 29-9099.00
HealthcareDegreeSearch.com provides higher-education, college and university, degree, program, career, salary, and other helpful information to students, faculty, institutions, and other internet audiences. Presented information and data are subject to change. Inclusion on this website does not imply or represent a direct relationship with the company, school, or brand. Information, though believed correct at time of publication, may not be correct, and no warranty is provided. Contact the schools to verify any information before relying on it. Financial aid may be available for those who qualify. The displayed options may include sponsored or recommended results, not necessarily based on your preferences.
© HealthcareDegreeSearch.com – All Rights Reserved.