Physical Therapists in District of Columbia
Considering working as a Physical Therapists in District of Columbia? Here’s what the data says. Assess, plan, organize, and participate in rehabilitative programs that improve mobility, relieve pain, increase strength, and improve or correct disabling conditions resulting from disease or injury.
What do Physical Therapists Make in District of Columbia?
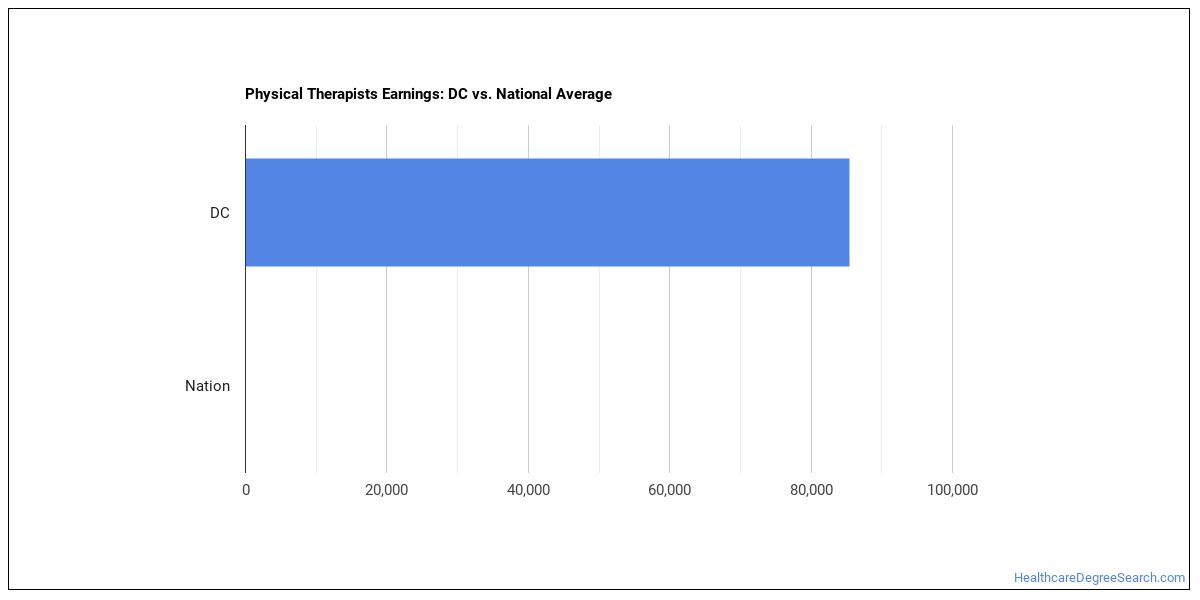
For physical therapists working in District of Columbia, wages run about $100,760 per year (or about $48.44/hour).Earnings range from $84,510 at the 10th percentile to $131,810 at the 90th percentile.
| Wage Statistic | Annual | Hourly |
|---|---|---|
| 10th percentile | $84,510 | $40.63 |
| 25th percentile | $97,220 | $46.74 |
| Median (50th) | $100,760 | $48.44 |
| 75th percentile | $124,650 | $59.93 |
| 90th percentile | $131,810 | $63.37 |

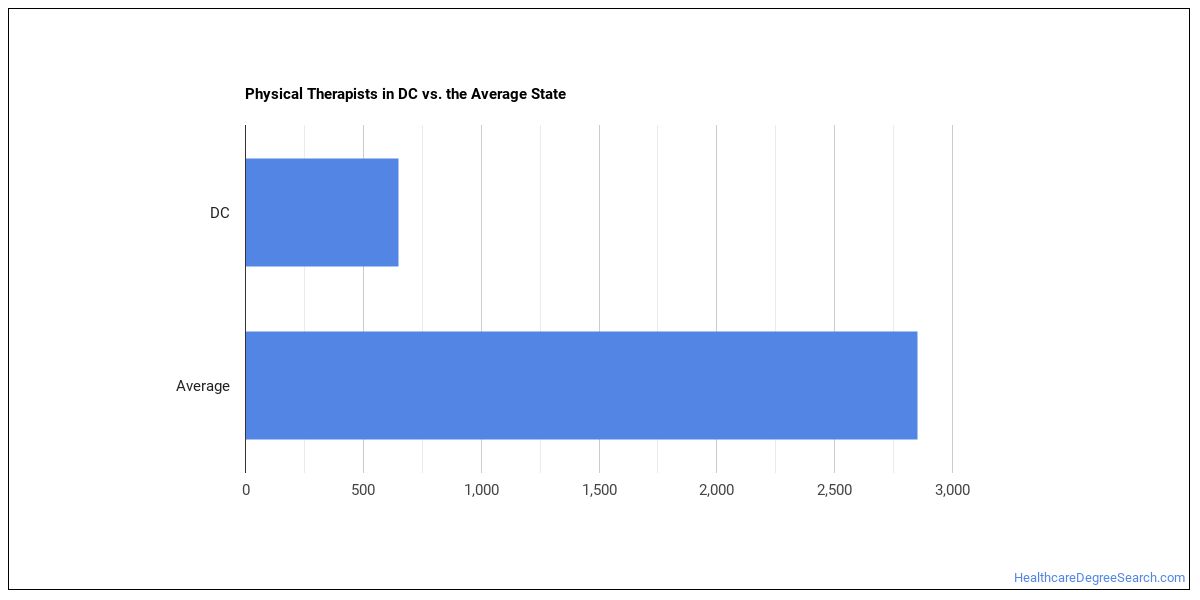
The job concentration index in District of Columbia relative to the national average — is 0.74, indicating fewer physical therapists per worker than the national average.
National Wage Comparison
Nationally, physical therapists earn a median of $144,047 per year ($69.25/hour), lower than the District of Columbia median.
Employment Outlook
There are roughly 2,206,692 physical therapists in the U.S.. In District of Columbia alone, approximately 850 people work in this role. That’s fewer than the typical state, which employs around 3,000 physical therapists.

Top District of Columbia Metros for Physical Therapists
The largest metro-area employers of physical therapists in District of Columbia.
| Metro Area | Number Employed | Annual Median Salary |
|---|---|---|
| Washington-Arlington-Alexandria, DC-VA-MD-WV | 4,670 | $104,860 |
Top States for Physical Therapists Employment
These states have the highest employment of physical therapists work.
| State | Number Employed |
|---|---|
| California | 24,380 |
| Texas | 18,930 |
| Florida | 17,050 |
| New York | 15,810 |
| Pennsylvania | 11,100 |
| Illinois | 10,390 |
| Ohio | 9,240 |
| Michigan | 7,800 |
| New Jersey | 7,760 |
| North Carolina | 7,350 |
| Virginia | 6,700 |
| Massachusetts | 6,600 |
| Georgia | 5,480 |
| Washington | 5,460 |
| Colorado | 5,430 |
| Wisconsin | 5,240 |
| Minnesota | 5,220 |
| Indiana | 5,180 |
| Arizona | 4,540 |
| Maryland | 4,420 |
Highest-Paying States for Physical Therapists
These states pay the most for physical therapists.
| State | Annual Median Salary |
|---|---|
| California | $123,300 |
| Alaska | $108,640 |
| New Jersey | $106,310 |
| Nevada | $105,170 |
| Oregon | $104,430 |
| Maryland | $104,330 |
| Connecticut | $103,720 |
| Texas | $103,710 |
| Illinois | $103,380 |
| Delaware | $103,120 |
Skills
Top physical therapists skills, rated on an importance scale of 0 to 5:
Knowledge Areas
Important knowledge areas for this occupation, rated on an importance scale of 0 to 5:
Abilities
The abilities that matter most for physical therapists, rated on an importance scale of 0 to 5:
Daily Tasks
Day-to-day, physical therapists typically:
- Plan, prepare, or carry out individually designed programs of physical treatment to maintain, improve, or restore physical functioning, alleviate pain, or prevent physical dysfunction in patients.
- Perform and document an initial exam, evaluating data to identify problems and determine a diagnosis prior to intervention.
- Record prognosis, treatment, response, and progress in patient's chart or enter information into computer.
- Instruct patient and family in treatment procedures to be continued at home.
- Evaluate effects of treatment at various stages and adjust treatments to achieve maximum benefit.
- Confer with the patient, medical practitioners, or appropriate others to plan, implement, or assess the intervention program.
- Administer manual exercises, massage, or traction to help relieve pain, increase patient strength, or decrease or prevent deformity or crippling.
- Obtain patients' informed consent to proposed interventions.
- Test and measure patient's strength, motor development and function, sensory perception, functional capacity, or respiratory or circulatory efficiency and record data.
- Direct, supervise, assess, and communicate with supportive personnel.
- Review physician's referral and patient's medical records to help determine diagnosis and physical therapy treatment required.
- Identify and document goals, anticipated progress, and plans for reevaluation.
Work Activities
- Assisting and Caring for Others
- Documenting/Recording Information
- Making Decisions and Solving Problems
- Performing for or Working Directly with the Public
- Getting Information
- Communicating with Supervisors, Peers, or Subordinates
- Updating and Using Relevant Knowledge
- Evaluating Information to Determine Compliance with Standards
- Establishing and Maintaining Interpersonal Relationships
- Monitoring Processes, Materials, or Surroundings
- Training and Teaching Others
- Identifying Objects, Actions, and Events
Tools & Technology
Technologies frequently used: Hot technologies: eClinicalWorks EHR software
What Major Will Prepare You For This Career?
Programs that train for this career include:
- Rehabilitation Professions
Featured schools near , edit
Related Careers
Careers similar to physical therapists include:
- Occupational Therapists
- Radiation Therapists
- Recreational Therapists
- Respiratory Therapists
- Registered Nurses
- Acute Care Nurses
Also Known As
Acute Care PT (Acute Care Physical Therapist), Acute Physical Therapist (Acute PT), Cardiopulmonary Physical Therapist (Cardiopulmonary PT), Doctor of Physical Therapy (DPT), Geriatric Physical Therapist (Geriatric PT), Home Care Physical Therapist (Home Care PT), Home Health Physical Therapist (Home Health PT), Inpatient Physical Therapist (Inpatient PT), Kinesiotherapist, LPT (Licensed Physical Therapist), Orthopedic Physical Therapist (Orthopedic PT), Outpatient Orthopedics Physical Therapist (Outpatient Ortho PT), Outpatient Physical Therapist (Outpatient PT), Outpatient Travel Physical Therapist (Outpatient Travel PT), Pediatric Physical Therapist (Pediatric PT).
References
- U.S. Bureau of Labor Statistics, Occupational Employment and Wage Statistics — https://www.bls.gov/oes/
- O*NET Online — https://www.onetonline.org/
- BLS Employment Projections — https://www.bls.gov/emp/
- O*NET-SOC code: 29-1123.00
HealthcareDegreeSearch.com provides higher-education, college and university, degree, program, career, salary, and other helpful information to students, faculty, institutions, and other internet audiences. Presented information and data are subject to change. Inclusion on this website does not imply or represent a direct relationship with the company, school, or brand. Information, though believed correct at time of publication, may not be correct, and no warranty is provided. Contact the schools to verify any information before relying on it. Financial aid may be available for those who qualify. The displayed options may include sponsored or recommended results, not necessarily based on your preferences.
© HealthcareDegreeSearch.com – All Rights Reserved.