Health Sciences & Services at Los Angeles Pacific University
What traits are you looking for in a school for Health Sciences & Services, you may want to check out the program at Los Angeles Pacific University. We’ve gathered the following information to help you decide.
Los Angeles Pacific University sits in San Dimas, CA.
During the most recent reporting year, 109 health sciences & services graduations were recorded at Los Angeles Pacific University.
Featured schools near , edit
Online & Distance Learning at Los Angeles Pacific University
Los Angeles Pacific University is a fully online institution, so Health Sciences & Services coursework can be completed remotely.
Median Debt at Graduation
The median debt for Health Sciences & Services graduates from Los Angeles Pacific University stands at $40,872.
Student Demographics & Diversity
Below you’ll find the composition of Health Sciences & Services graduates at Los Angeles Pacific University, broken down by degree level.
Program-wide, Health Sciences & Services graduates at Los Angeles Pacific University are 83% women (91) and 17% men (18).
Health Sciences & Services Associate’s Program at Los Angeles Pacific University
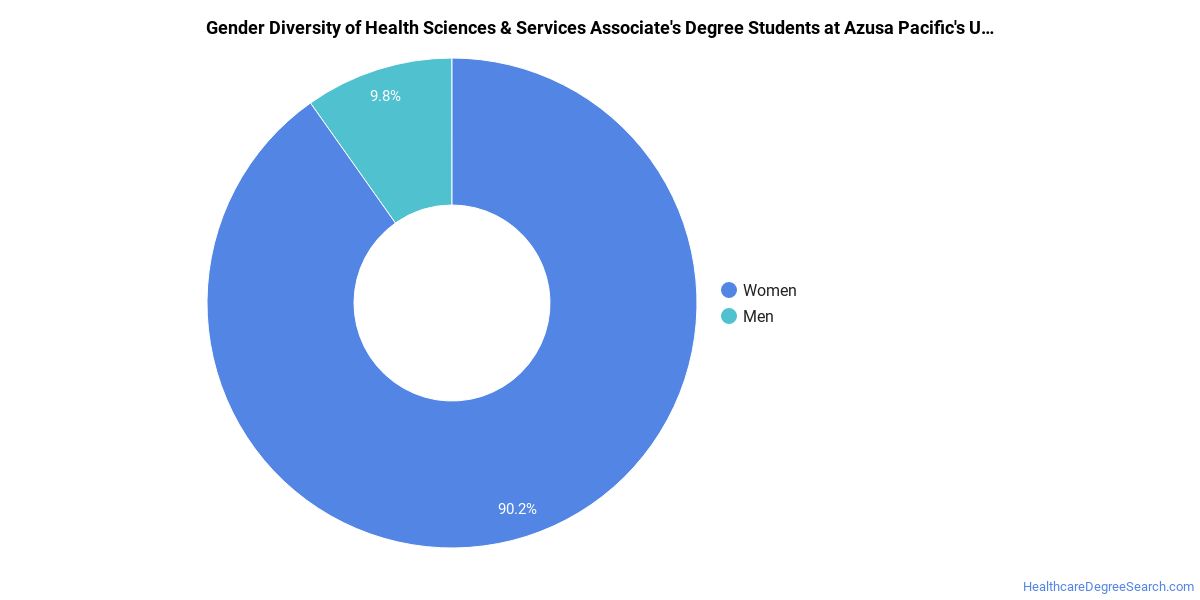
Among the 76 associate’s health sciences & services graduates at Los Angeles Pacific University, 86% were women (65) and 14% were men (11).
The following table and chart show the race/ethnicity of Health Sciences & Services associate’s degree recipients at Los Angeles Pacific University.
| Race / Ethnicity | Number of Graduates |
|---|---|
| White | 11 |
| Hispanic / Latino | 37 |
| Black / African American | 13 |
| Asian | 6 |
| American Indian / Alaska Native | 1 |
| Native Hawaiian / Pacific Islander | 1 |
| Two or More Races | 3 |
| Unknown | 4 |
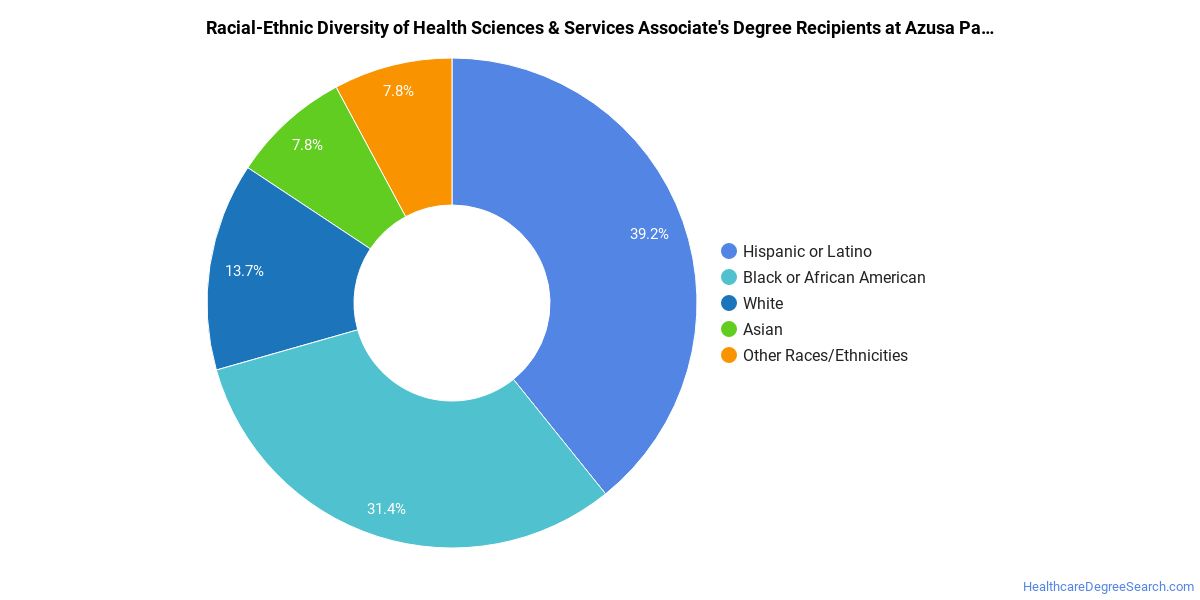
Racial-ethnic minorities make up 80% of Health Sciences & Services associate’s degree recipients at Los Angeles Pacific University, above the national average of 65%.*
Health Sciences & Services Bachelor’s Program at Los Angeles Pacific University
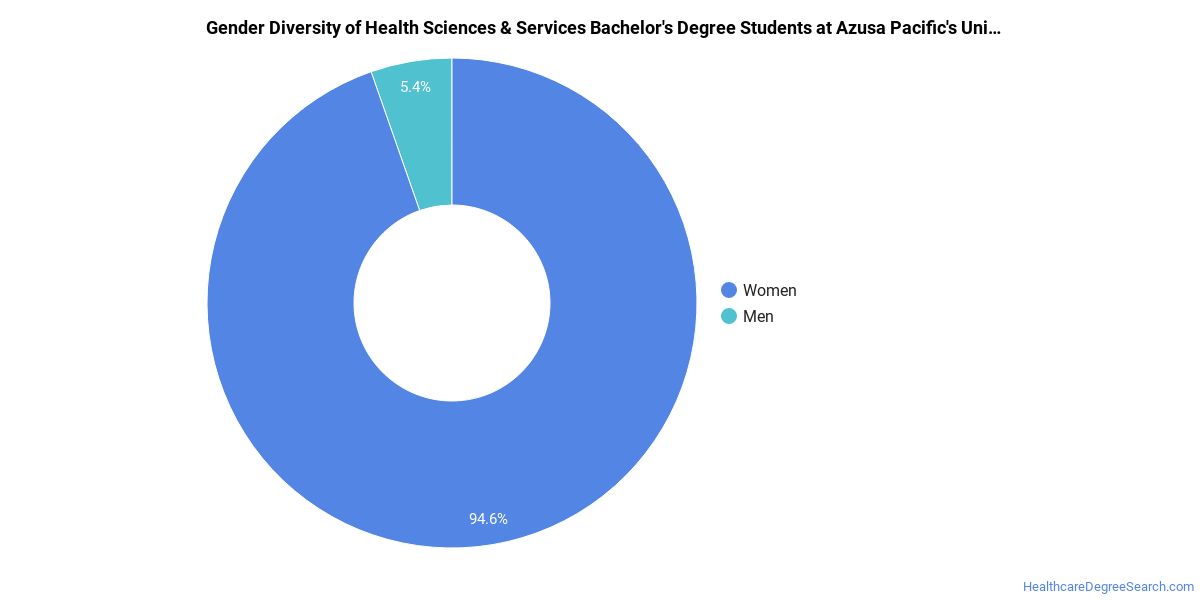
Among the 33 bachelor’s health sciences & services degrees awarded at Los Angeles Pacific University, 79% were women (26) and 21% were men (7).
The following table and chart show the race/ethnicity of Health Sciences & Services bachelor’s degree recipients at Los Angeles Pacific University.
| Race / Ethnicity | Number of Graduates |
|---|---|
| White | 7 |
| Hispanic / Latino | 16 |
| Black / African American | 5 |
| Asian | 2 |
| Two or More Races | 2 |
| Unknown | 1 |
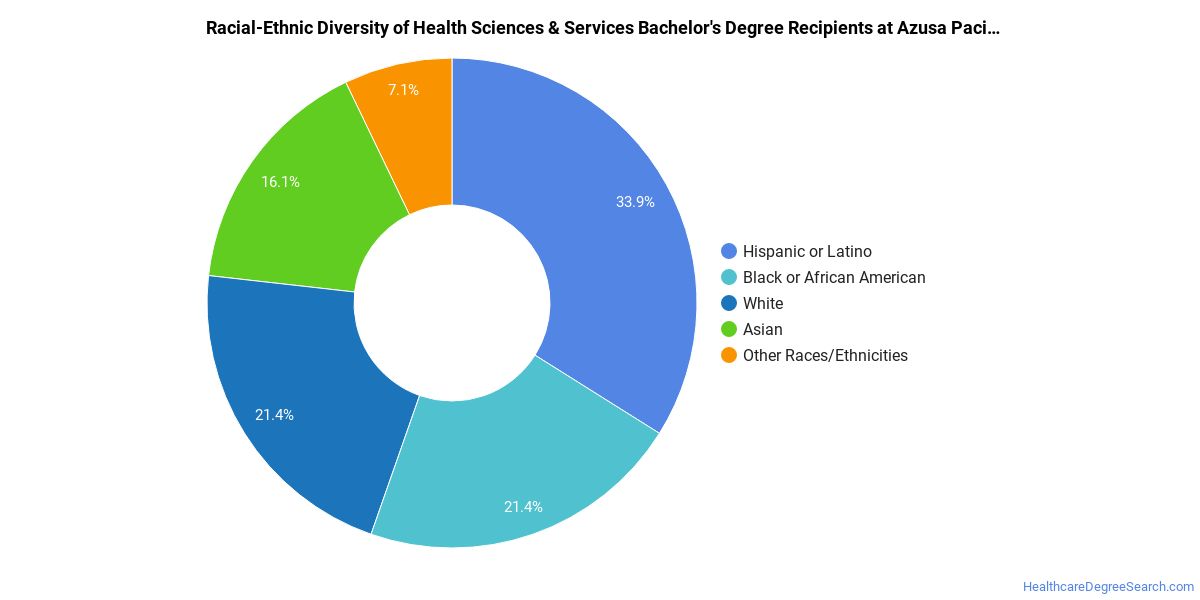
Racial-ethnic minorities make up 76% of Health Sciences & Services bachelor’s degree recipients at Los Angeles Pacific University, above the national average of 50%.*
*The racial-ethnic minorities figure is the total number of graduates minus White, international (nonresident), and unknown-race graduates.
More Specific Health Sciences & Services Concentrations at Los Angeles Pacific University
The Health Sciences & Services program at Los Angeles Pacific University includes the following sub-specializations:
| Concentration | Graduates |
|---|---|
| General/Allied Health Sciences | 109 |
Best-Paid Careers for Health Sciences & Services Graduates
Students who finish Health Sciences & Services program at Los Angeles Pacific University pursue many career paths. The table below ranks the top-paying careers for Health Sciences & Services graduates, ordered by median annual salary:
| Occupation | Nationwide Median Wage |
|---|---|
| Health Education Specialists | $81,726 |
| Community Health Workers | $73,901 |
References
- IPEDS — Integrated Postsecondary Education Data System
- U.S. Department of Education — College Scorecard
- O*NET Online (Bureau of Labor Statistics)
- National Center for Education Statistics
More about our data sources and methodologies.
HealthcareDegreeSearch.com provides higher-education, college and university, degree, program, career, salary, and other helpful information to students, faculty, institutions, and other internet audiences. Presented information and data are subject to change. Inclusion on this website does not imply or represent a direct relationship with the company, school, or brand. Information, though believed correct at time of publication, may not be correct, and no warranty is provided. Contact the schools to verify any information before relying on it. Financial aid may be available for those who qualify. The displayed options may include sponsored or recommended results, not necessarily based on your preferences.
© HealthcareDegreeSearch.com – All Rights Reserved.