Health Sciences & Services at Boston University
If you are interested in studying Health Sciences & Services, take a look at what Boston University. We’ve gathered the following information to help you decide.
Boston University is located in Boston, MA.
In the most recent year for which we have data, 138 health sciences & services degrees were awarded at Boston University.
Featured schools near , edit
Studying Online at Boston University
Many students take online classes at Boston University. Of 37,737 students, 5,423 (14%) studied exclusively online and 1,354 (4%) took at least some classes online.
Health Sciences & Services Rankings at Boston University
Use these rankings to compare Boston University’s Health Sciences & Services program against peer institutions.
Bachelor’s-Level Rankings
| Ranking | Scope | Rank |
|---|---|---|
| Best Schools (Quality) | Massachusetts | #1 of 16 |
| Best Schools (Quality) | New England (Region) | #1 of 38 |
| Best Value | Massachusetts | #9 of 17 |
| Best Schools (Quality) | Nationwide | #10 of 478 |
| Best Value | New England (Region) | #21 of 39 |
| Best Value | Nationwide | #400 of 471 |
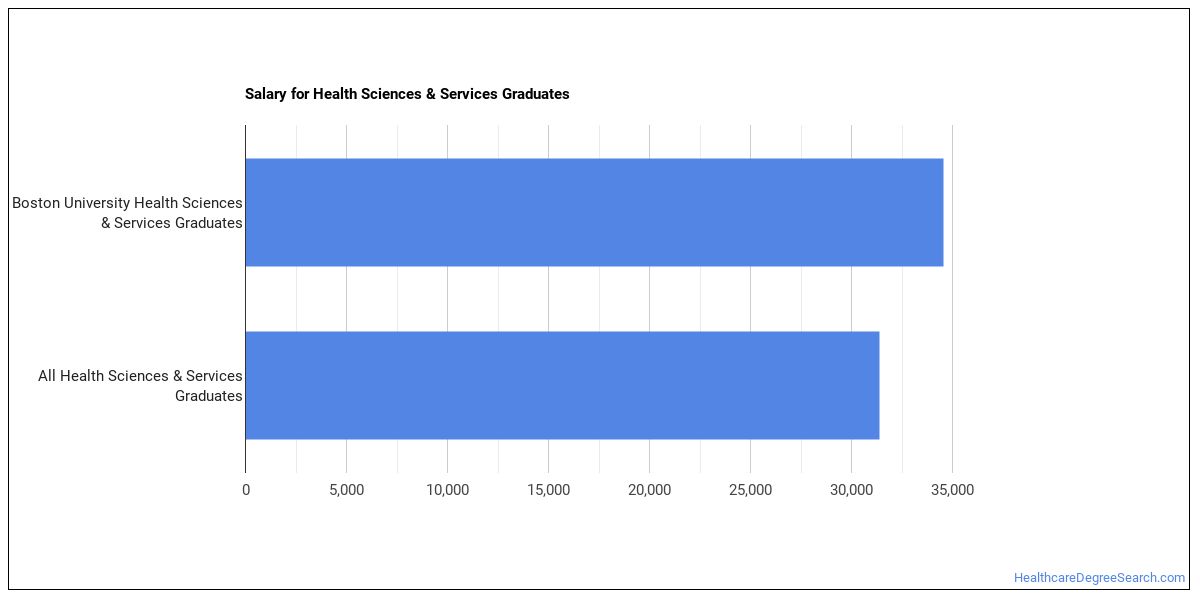
Earnings for Health Sciences & Services Graduates from Boston University
Graduates of Boston University’s Health Sciences & Services program earn the following amounts (per the U.S. Department of Education’s College Scorecard):
| Years After Graduation | Median Earnings |
|---|---|
| 1 year | $34,542 |
| 2 years | $35,653 |
| 3 years | $48,978 |
| 4 years | $59,945 |
| 5 years | $75,810 |
Is this above or below average for the school? Four years after graduating, Health Sciences & Services graduates from Boston University report median earnings of $59,945, compared with $86,455 for all Boston University graduates — about 31% lower than the school-wide median.

Median Debt at Graduation
Median student loan debt for Health Sciences & Services graduates from Boston University stands at $26,000.
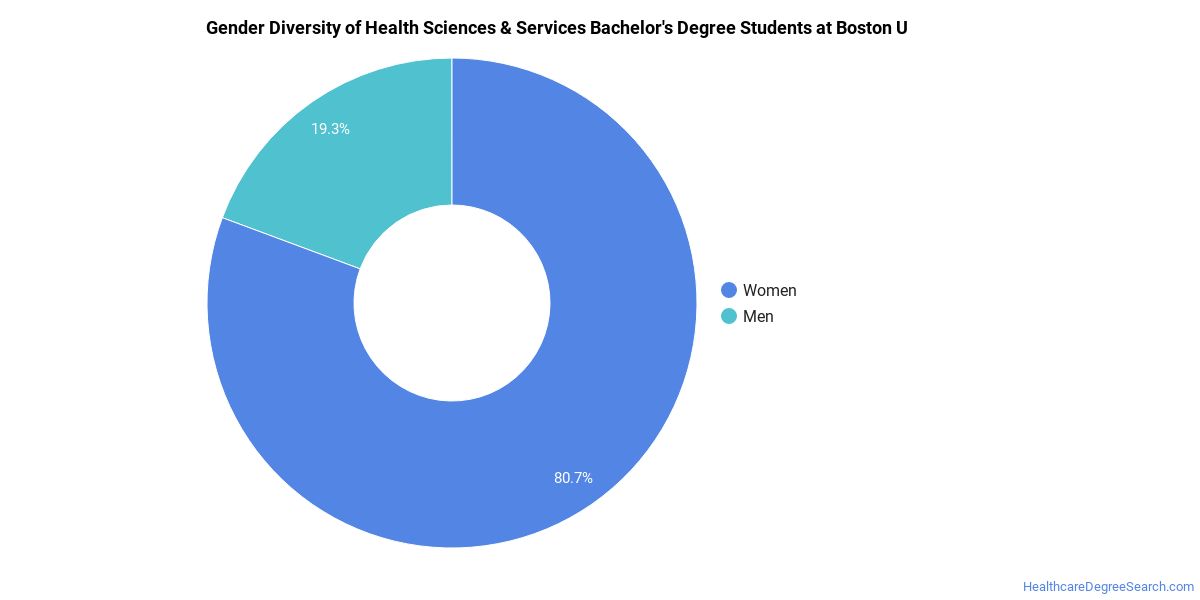
Student Demographics & Diversity
Take a look at the composition of Health Sciences & Services graduates at Boston University, broken down by degree level.
Looking at the program as a whole, Health Sciences & Services graduates at Boston University are 83% women (114) and 17% men (24).
Health Sciences & Services Bachelor’s Program at Boston University
Of the 138 bachelor’s health sciences & services graduates at Boston University, 83% were women (114) and 17% were men (24).
The following table and chart show the race/ethnicity of Health Sciences & Services bachelor’s degree recipients at Boston University.
| Race / Ethnicity | Number of Graduates |
|---|---|
| White | 64 |
| Hispanic / Latino | 13 |
| Black / African American | 6 |
| Asian | 39 |
| Two or More Races | 8 |
| International (Nonresident) | 4 |
| Unknown | 4 |
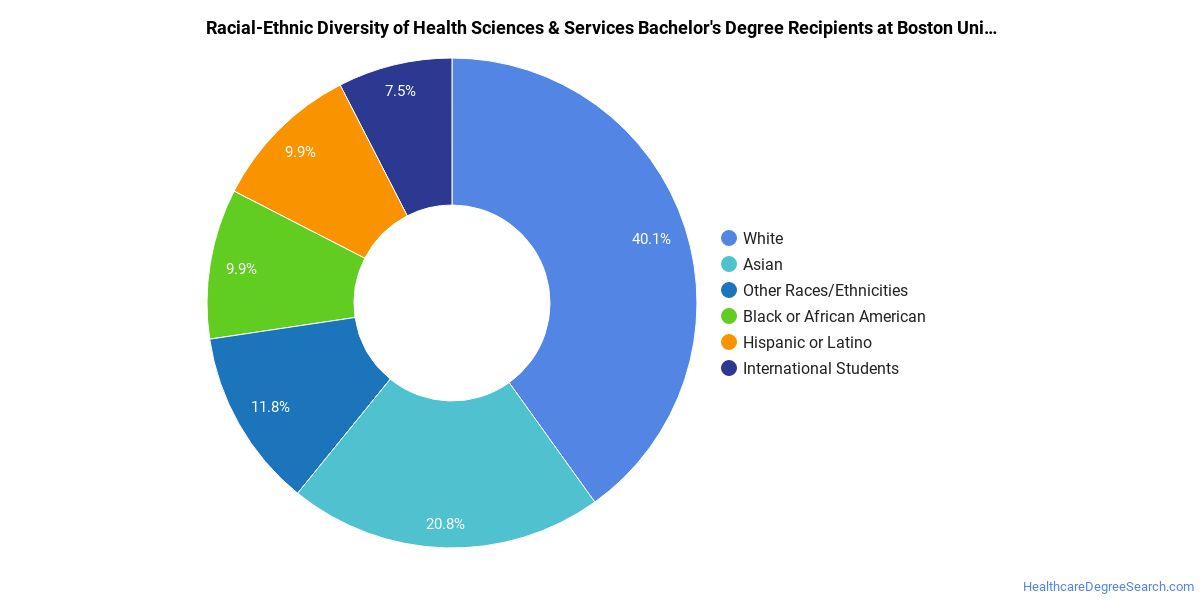
Minority students account for 48% of Health Sciences & Services bachelor’s degree recipients at Boston University, lower than the national average of 50%.*
*The racial-ethnic minorities figure is the total number of graduates minus White, international (nonresident), and unknown-race graduates.
More Specific Health Sciences & Services Concentrations at Boston University
The Health Sciences & Services program at Boston University offers more specialized concentrations:
| Concentration | Graduates |
|---|---|
| General/Allied Health Sciences | 138 |
Top-Paying Careers for Health Sciences & Services Graduates
Those who complete Health Sciences & Services program at Boston University go on to a range of careers. Here are the highest-paying careers for Health Sciences & Services majors, ordered by median annual salary:
| Occupation | Nationwide Median Wage |
|---|---|
| Health Education Specialists | $81,726 |
| Community Health Workers | $73,901 |
References
- IPEDS — Integrated Postsecondary Education Data System
- U.S. Department of Education — College Scorecard
- O*NET Online (Bureau of Labor Statistics)
- National Center for Education Statistics
More about our data sources and methodologies.
HealthcareDegreeSearch.com provides higher-education, college and university, degree, program, career, salary, and other helpful information to students, faculty, institutions, and other internet audiences. Presented information and data are subject to change. Inclusion on this website does not imply or represent a direct relationship with the company, school, or brand. Information, though believed correct at time of publication, may not be correct, and no warranty is provided. Contact the schools to verify any information before relying on it. Financial aid may be available for those who qualify. The displayed options may include sponsored or recommended results, not necessarily based on your preferences.
© HealthcareDegreeSearch.com – All Rights Reserved.