Health Sciences & Services at Carroll College
What traits are you looking for in a school for Health Sciences & Services, consider the program at Carroll College. The following information will help you decide if it is a good fit for you.
Carroll College sits in Helena, MT.
For the most recent IPEDS reporting year, 25 health sciences & services graduations were recorded at Carroll College.
Featured schools near , edit
Online Class Availability at Carroll College
Online coursework is an option at Carroll College. Among 1,156 students, 1 (0%) studied exclusively online and 363 (31%) took at least some classes online.
Health Sciences & Services Rankings at Carroll College
These rankings give you a sense of how Carroll College’s Health Sciences & Services program to other colleges that offer this major.
Bachelor’s-Level Rankings
| Ranking | Scope | Rank |
|---|---|---|
| Best Schools (Quality) | Montana | #1 of 2 |
| Best Value | Montana | #2 of 2 |
| Best Schools (Quality) | Rocky Mountains (Region) | #12 of 22 |
| Best Value | Rocky Mountains (Region) | #21 of 21 |
| Best Schools (Quality) | Nationwide | #295 of 478 |
| Best Value | Nationwide | #390 of 471 |
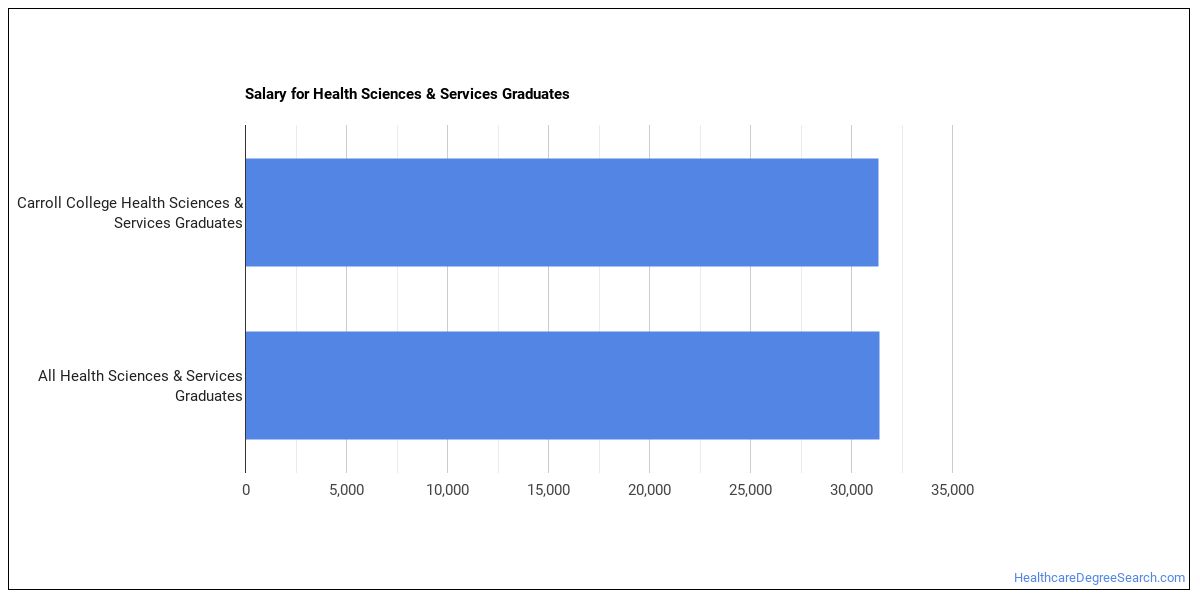
Earnings for Health Sciences & Services Graduates from Carroll College
Students who complete Carroll College’s Health Sciences & Services program earn the following amounts (per the U.S. Department of Education’s College Scorecard):
| Years After Graduation | Median Earnings |
|---|---|
| 1 year | $31,351 |
| 2 years | $30,119 |
| 3 years | $38,625 |
| 5 years | $51,857 |
Median Debt at Graduation
Typical debt at graduation for Health Sciences & Services graduates from Carroll College comes in at $25,250.
Student Demographics & Diversity
The following sections describe the composition of Health Sciences & Services graduates at Carroll College, by degree type.
Across all degree levels, Health Sciences & Services graduates at Carroll College are 72% women (18) and 28% men (7).
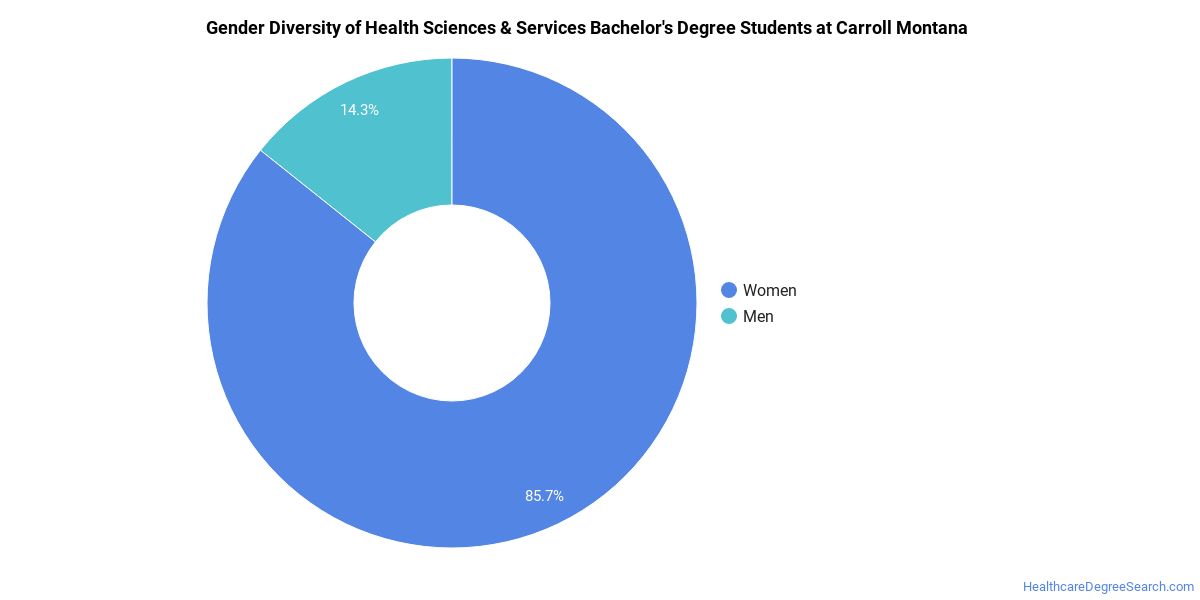
Health Sciences & Services Bachelor’s Program at Carroll College
Of the 25 bachelor’s health sciences & services degrees awarded at Carroll College, 72% were women (18) and 28% were men (7).
The following table and chart show the race/ethnicity of Health Sciences & Services bachelor’s degree recipients at Carroll College.
| Race / Ethnicity | Number of Graduates |
|---|---|
| White | 19 |
| Hispanic / Latino | 3 |
| Two or More Races | 1 |
| Unknown | 2 |
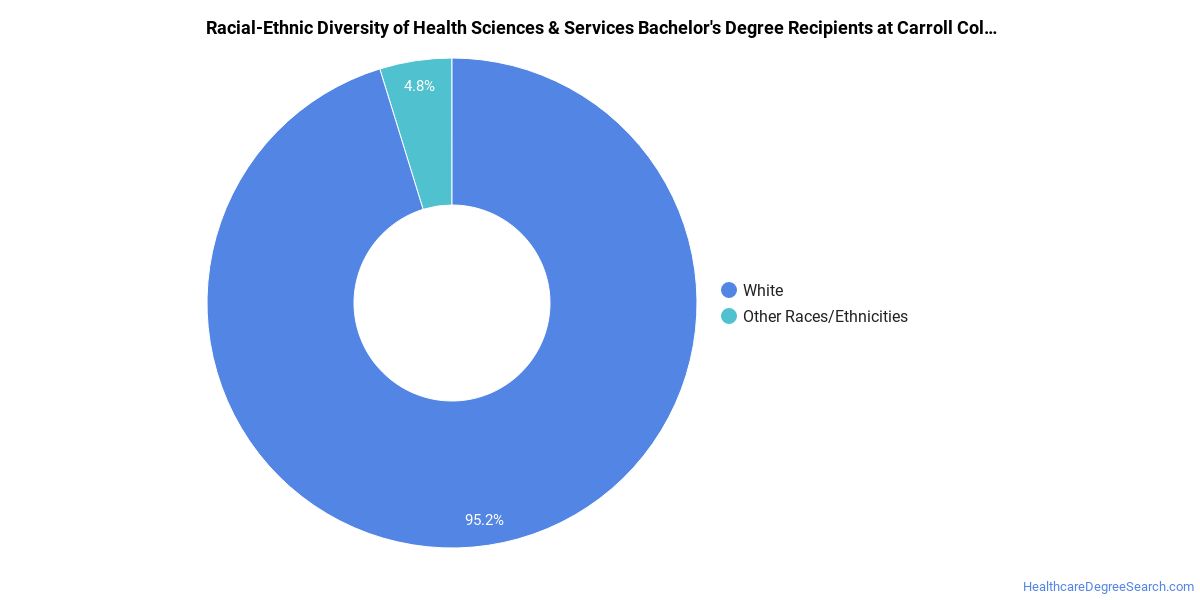
Racial-ethnic minorities make up 16% of Health Sciences & Services bachelor’s degree recipients at Carroll College, lower than the national average of 50%.*
*The racial-ethnic minorities figure is the total number of graduates minus White, international (nonresident), and unknown-race graduates.
More Specific Health Sciences & Services Concentrations at Carroll College
This Health Sciences & Services program at Carroll College offers more specialized concentrations:
| Concentration | Graduates |
|---|---|
| General/Allied Health Sciences | 25 |
Highest-Paying Careers for Health Sciences & Services Graduates
Students who finish Health Sciences & Services program at Carroll College pursue many career paths. The table below ranks the best-paid careers for Health Sciences & Services majors, ordered by median annual salary:
| Occupation | Nationwide Median Wage |
|---|---|
| Health Education Specialists | $81,726 |
| Community Health Workers | $73,901 |
References
- IPEDS — Integrated Postsecondary Education Data System
- U.S. Department of Education — College Scorecard
- O*NET Online (Bureau of Labor Statistics)
- National Center for Education Statistics
More about our data sources and methodologies.
HealthcareDegreeSearch.com provides higher-education, college and university, degree, program, career, salary, and other helpful information to students, faculty, institutions, and other internet audiences. Presented information and data are subject to change. Inclusion on this website does not imply or represent a direct relationship with the company, school, or brand. Information, though believed correct at time of publication, may not be correct, and no warranty is provided. Contact the schools to verify any information before relying on it. Financial aid may be available for those who qualify. The displayed options may include sponsored or recommended results, not necessarily based on your preferences.
© HealthcareDegreeSearch.com – All Rights Reserved.