General/Allied Health Sciences at Carroll University
If you are interested in studying General/Allied Health Sciences, take a look at what Carroll University. The following information will help you decide if it is a good fit for you.
Carroll University sits in Waukesha, WI.
For the most recent IPEDS reporting year, 16 general/allied health sciences degrees were granted at Carroll University.
Featured schools near , edit
Online Class Availability at Carroll University
Distance learning is available at Carroll University. Among 3,138 students, 9 (0%) studied exclusively online and 470 (15%) took at least some classes online.
General/Allied Health Sciences Rankings at Carroll University
Rankings can help you compare Carroll University’s General/Allied Health Sciences program against other schools offering the same major.
Bachelor’s-Level Rankings
| Ranking | Scope | Rank |
|---|---|---|
| Best Schools (Quality) | Wisconsin | #1 of 2 |
| Best Value | Wisconsin | #1 of 1 |
| Best Schools (Quality) | Great Lakes (Region) | #6 of 27 |
| Best Value | Great Lakes (Region) | #22 of 26 |
| Best Schools (Quality) | Nationwide | #45 of 398 |
| Best Value | Nationwide | #326 of 406 |
Student Demographics & Diversity
Below you’ll find the composition of General/Allied Health Sciences graduates at Carroll University, broken down by degree level.
Program-wide, General/Allied Health Sciences graduates at Carroll University are 94% women (15) and 6% men (1).
General/Allied Health Sciences Bachelor’s Program at Carroll University
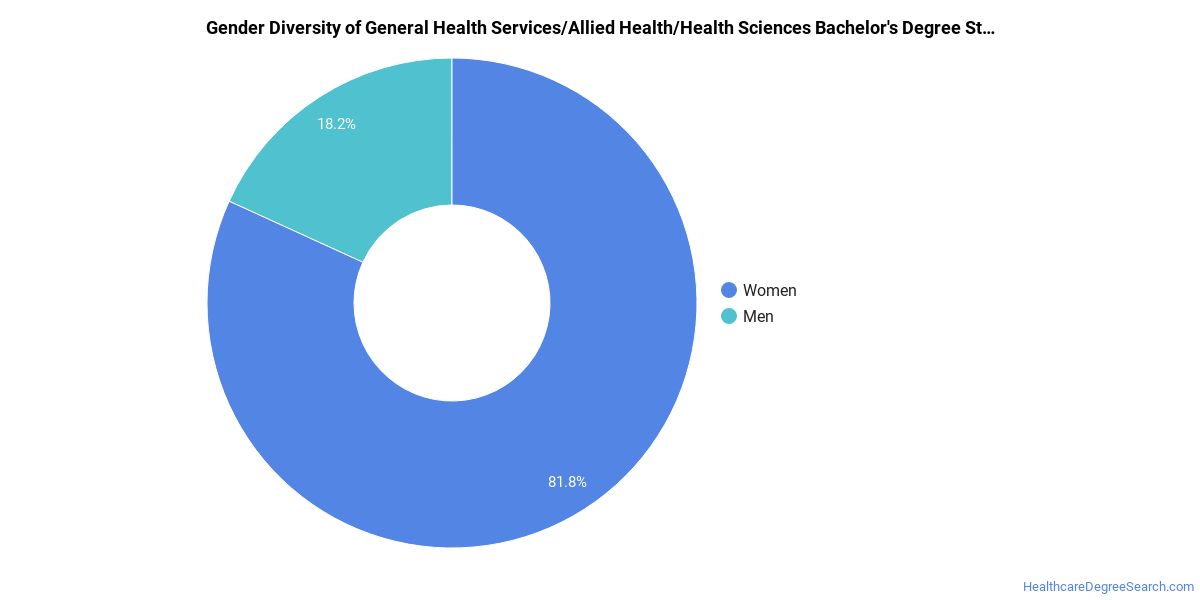
Of the 16 bachelor’s general/allied health sciences degrees awarded at Carroll University, 94% were women (15) and 6% were men (1).
The following table and chart show the race/ethnicity of General/Allied Health Sciences bachelor’s degree recipients at Carroll University.
| Race / Ethnicity | Number of Graduates |
|---|---|
| White | 14 |
| Two or More Races | 1 |
| Unknown | 1 |
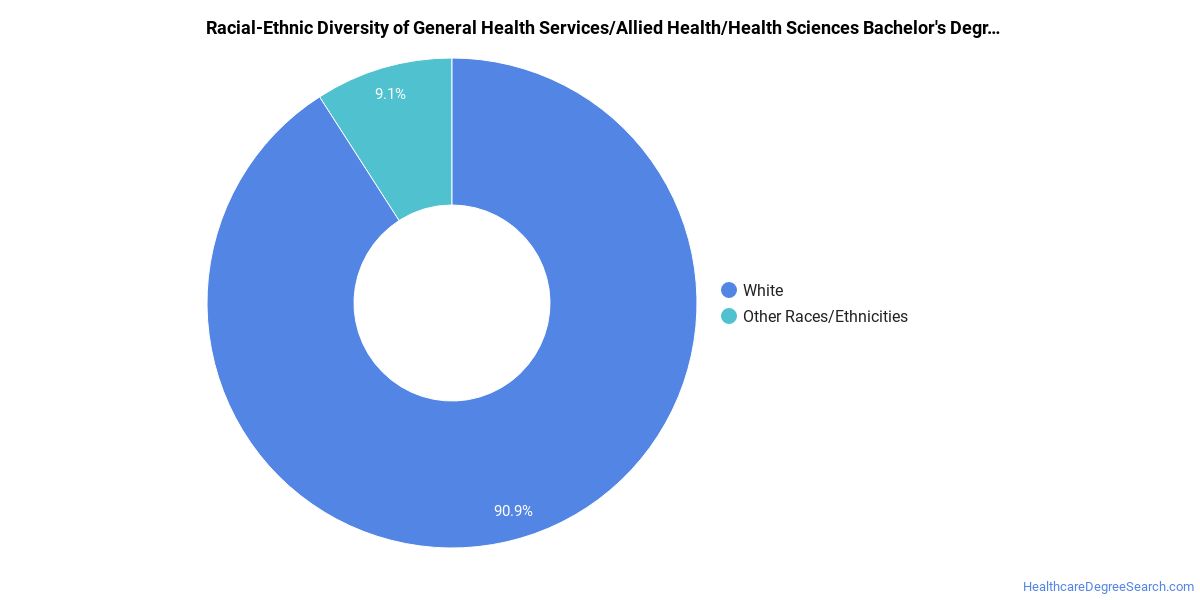
Racial-ethnic minorities make up 6% of General/Allied Health Sciences bachelor’s degree recipients at Carroll University, lower than the national average of 51%.*
*The racial-ethnic minorities figure is the total number of graduates minus White, international (nonresident), and unknown-race graduates.
References
- IPEDS — Integrated Postsecondary Education Data System
- U.S. Department of Education — College Scorecard
- O*NET Online (Bureau of Labor Statistics)
- National Center for Education Statistics
More about our data sources and methodologies.
HealthcareDegreeSearch.com provides higher-education, college and university, degree, program, career, salary, and other helpful information to students, faculty, institutions, and other internet audiences. Presented information and data are subject to change. Inclusion on this website does not imply or represent a direct relationship with the company, school, or brand. Information, though believed correct at time of publication, may not be correct, and no warranty is provided. Contact the schools to verify any information before relying on it. Financial aid may be available for those who qualify. The displayed options may include sponsored or recommended results, not necessarily based on your preferences.
© HealthcareDegreeSearch.com – All Rights Reserved.