Clinical/Medical Science Professions at Cleveland State University
What traits are you looking for in a school for Clinical/Medical Science Professions, consider the program at Cleveland State University. Get started with the following essential facts.
Cleveland State University is in Cleveland, OH.
During the most recent reporting year, 163 clinical/medical science professions degrees were granted at Cleveland State University.
Featured schools near , edit
Online & Distance Learning at Cleveland State University
Online coursework is an option at Cleveland State University. Of 14,074 students, 2,129 (15%) were enrolled entirely in distance education and 5,908 (42%) took at least some classes online.
Clinical/Medical Science Professions Rankings at Cleveland State University
Use these rankings to compare Cleveland State University’s Clinical/Medical Science Professions program against peer institutions.
Bachelor’s-Level Rankings
| Ranking | Scope | Rank |
|---|---|---|
| Best Schools (Quality) | Ohio | #2 of 2 |
| Best Value | Ohio | #3 of 3 |
| Best Schools (Quality) | Great Lakes (Region) | #4 of 4 |
| Best Value | Great Lakes (Region) | #4 of 5 |
| Best Value | Nationwide | #14 of 26 |
| Best Schools (Quality) | Nationwide | #16 of 16 |
Master’s-Level Rankings
| Ranking | Scope | Rank |
|---|---|---|
| Best Schools (Quality) | Ohio | #2 of 2 |
| Best Value | Ohio | #3 of 3 |
| Best Schools (Quality) | Great Lakes (Region) | #4 of 4 |
| Best Value | Great Lakes (Region) | #4 of 5 |
| Best Value | Nationwide | #14 of 26 |
| Best Schools (Quality) | Nationwide | #16 of 16 |
Student Demographics & Diversity
Below you’ll find the student demographics for Clinical/Medical Science Professions graduates at Cleveland State University, by degree type.
Program-wide, Clinical/Medical Science Professions graduates at Cleveland State University are 74% women (120) and 26% men (43).
Clinical/Medical Science Professions Bachelor’s Program at Cleveland State University
Among the 160 bachelor’s clinical/medical science professions graduates at Cleveland State University, 74% were women (119) and 26% were men (41).

The following table and chart show the race/ethnicity of Clinical/Medical Science Professions bachelor’s degree recipients at Cleveland State University.
| Race / Ethnicity | Number of Graduates |
|---|---|
| White | 99 |
| Hispanic / Latino | 21 |
| Black / African American | 19 |
| Asian | 10 |
| Two or More Races | 4 |
| International (Nonresident) | 2 |
| Unknown | 5 |
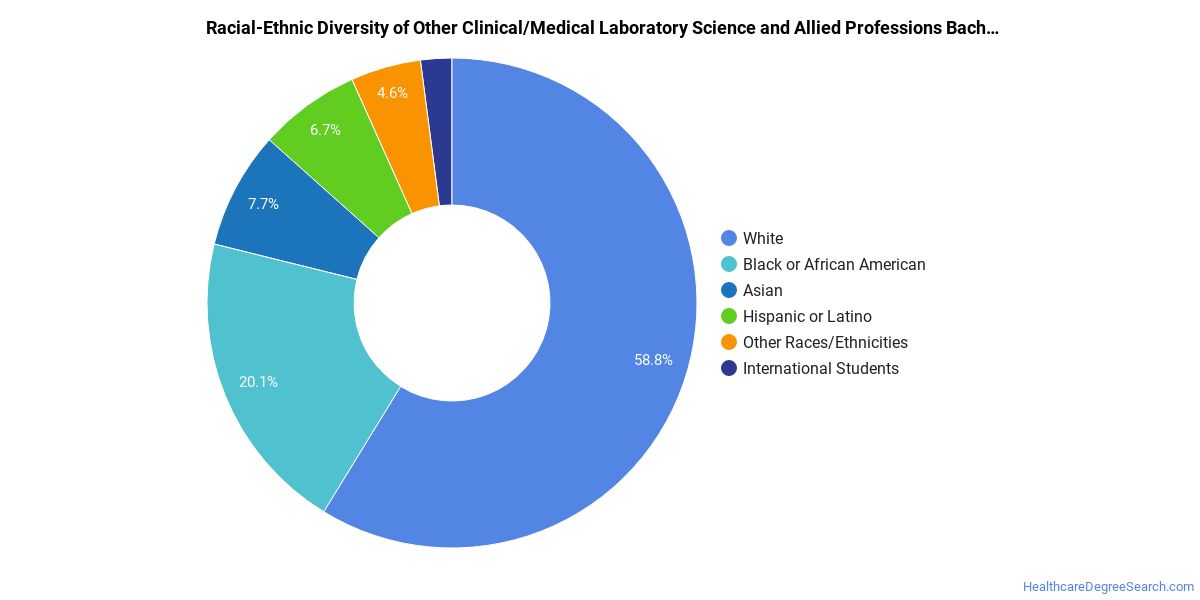
Minority students account for 34% of Clinical/Medical Science Professions bachelor’s degree recipients at Cleveland State University, below the national average of 46%.*
Clinical/Medical Science Professions Master’s Program at Cleveland State University
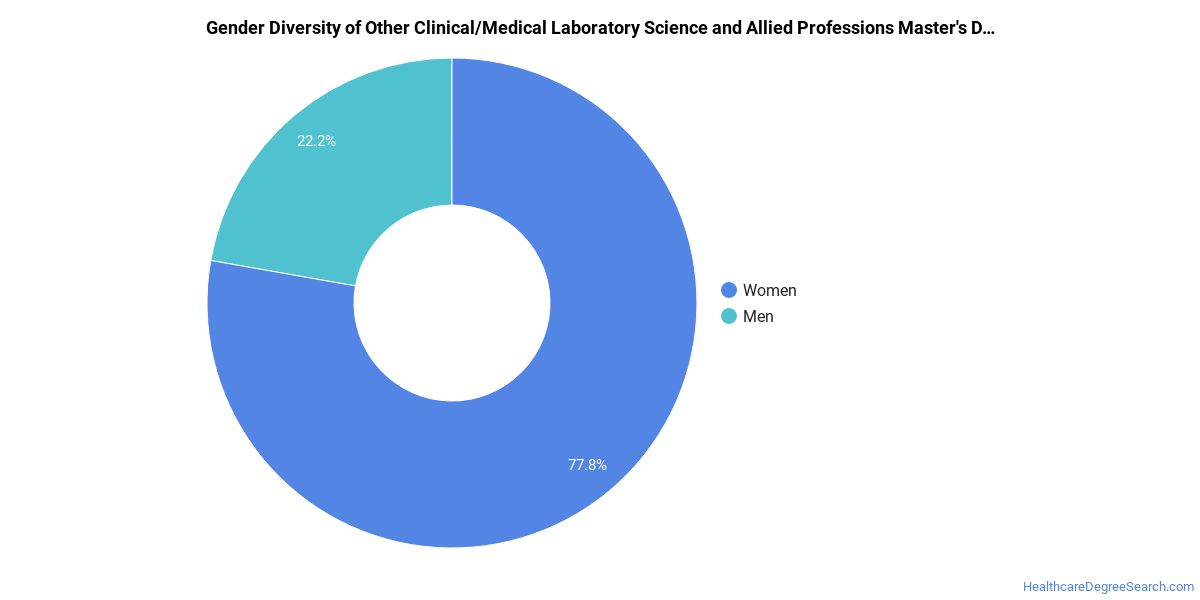
Of the 3 master’s clinical/medical science professions degrees awarded at Cleveland State University, 33% were women (1) and 67% were men (2).
The following table and chart show the race/ethnicity of Clinical/Medical Science Professions master’s degree recipients at Cleveland State University.
| Race / Ethnicity | Number of Graduates |
|---|---|
| Hispanic / Latino | 1 |
| International (Nonresident) | 2 |
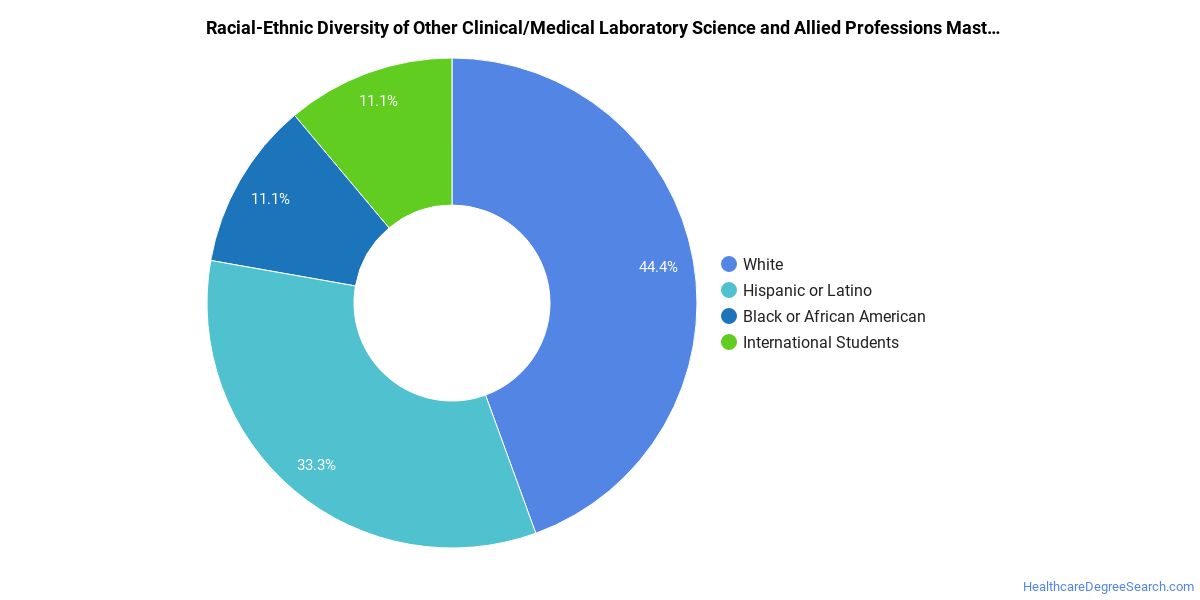
Minority students account for 33% of Clinical/Medical Science Professions master’s degree recipients at Cleveland State University, lower than the national average of 37%.*
*The racial-ethnic minorities figure is the total number of graduates minus White, international (nonresident), and unknown-race graduates.
Top-Paying Careers for Clinical/Medical Science Professions Graduates
Students who finish Clinical/Medical Science Professions program at Cleveland State University work across a variety of fields. Here are the highest-paying careers for Clinical/Medical Science Professions graduates, ordered by median annual salary:
| Occupation | Nationwide Median Wage |
|---|---|
| Medical and Clinical Laboratory Technicians | $155,908 |
| Cytotechnologists | $155,812 |
| Cytogenetic Technologists | $155,361 |
| Histotechnologists | $125,527 |
| Histology Technicians | $80,721 |
| Medical and Clinical Laboratory Technologists | $77,339 |
| Health Specialties Teachers, Postsecondary | $46,663 |
References
- IPEDS — Integrated Postsecondary Education Data System
- U.S. Department of Education — College Scorecard
- O*NET Online (Bureau of Labor Statistics)
- National Center for Education Statistics
More about our data sources and methodologies.
HealthcareDegreeSearch.com provides higher-education, college and university, degree, program, career, salary, and other helpful information to students, faculty, institutions, and other internet audiences. Presented information and data are subject to change. Inclusion on this website does not imply or represent a direct relationship with the company, school, or brand. Information, though believed correct at time of publication, may not be correct, and no warranty is provided. Contact the schools to verify any information before relying on it. Financial aid may be available for those who qualify. The displayed options may include sponsored or recommended results, not necessarily based on your preferences.
© HealthcareDegreeSearch.com – All Rights Reserved.