Health Sciences & Services at Community College of Vermont
What traits are you looking for in a school for Health Sciences & Services, consider the program at Community College of Vermont. Get started with the following essential facts.
Community College of Vermont is located in Montpelier, VT.
For the most recent IPEDS reporting year, 55 health sciences & services degrees were granted at Community College of Vermont.
Featured schools near , edit
Online Class Availability at Community College of Vermont
Online coursework is an option at Community College of Vermont. Of 5,028 students, 3,172 (63%) were enrolled entirely in distance education and 667 (13%) took at least some classes online.
Health Sciences & Services Rankings at Community College of Vermont
Use these rankings to compare Community College of Vermont’s Health Sciences & Services program against other schools offering the same major.
Associate-Level Rankings
| Ranking | Scope | Rank |
|---|---|---|
| Best Value | Vermont | #1 of 4 |
| Best Schools (Quality) | Vermont | #4 of 4 |
| Best Value | New England (Region) | #10 of 39 |
| Best Schools (Quality) | New England (Region) | #36 of 38 |
| Best Value | Nationwide | #218 of 471 |
| Best Schools (Quality) | Nationwide | #459 of 478 |
Student Demographics & Diversity
The following sections describe the diversity of Health Sciences & Services graduates at Community College of Vermont, by degree type.
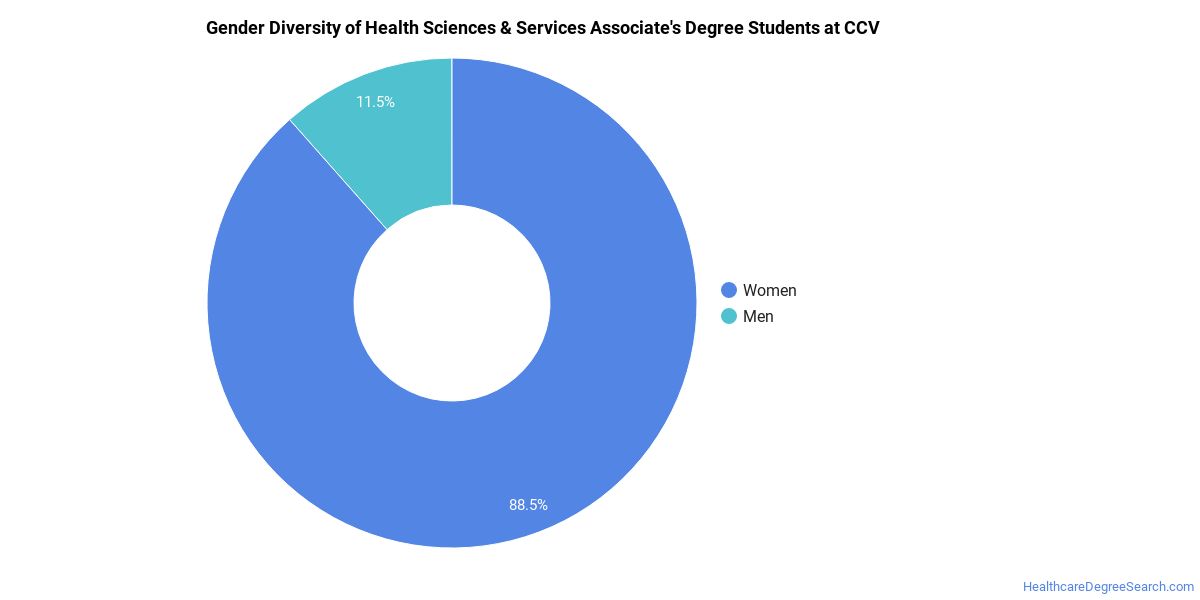
Looking at the program as a whole, Health Sciences & Services graduates at Community College of Vermont are 84% women (46) and 16% men (9).
Health Sciences & Services Associate’s Program at Community College of Vermont
Among the 55 associate’s health sciences & services degrees awarded at Community College of Vermont, 84% were women (46) and 16% were men (9).
The following table and chart show the race/ethnicity of Health Sciences & Services associate’s degree recipients at Community College of Vermont.
| Race / Ethnicity | Number of Graduates |
|---|---|
| White | 45 |
| Hispanic / Latino | 2 |
| Black / African American | 3 |
| Asian | 1 |
| Two or More Races | 2 |
| International (Nonresident) | 2 |
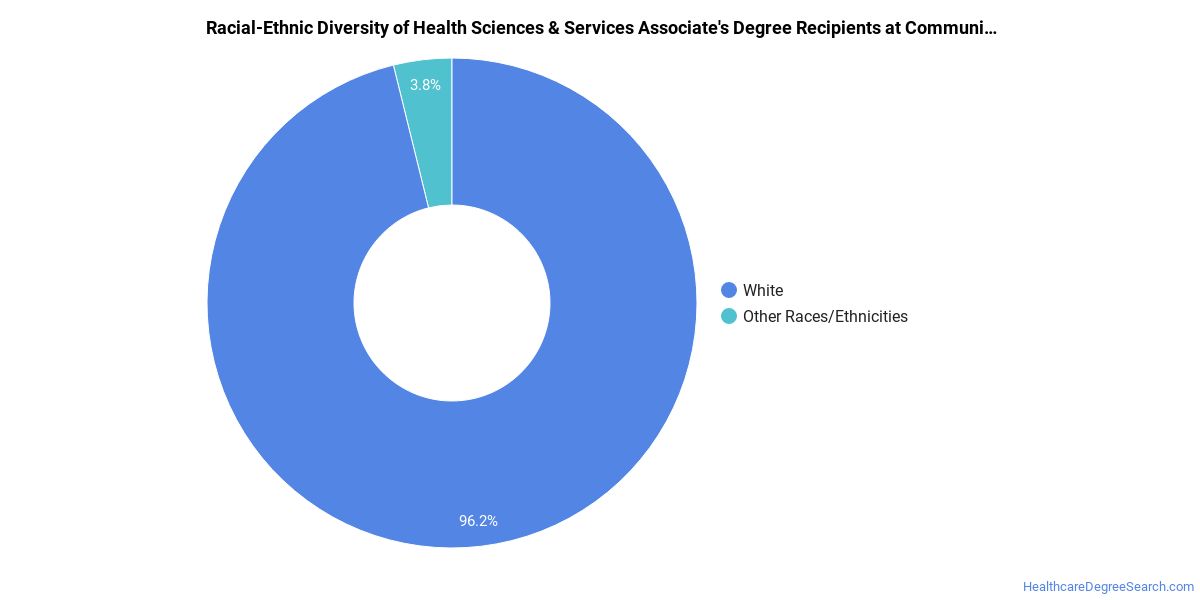
Racial-ethnic minorities make up 15% of Health Sciences & Services associate’s degree recipients at Community College of Vermont, below the national average of 65%.*
*The racial-ethnic minorities figure is the total number of graduates minus White, international (nonresident), and unknown-race graduates.
More Specific Health Sciences & Services Concentrations at Community College of Vermont
The Health Sciences & Services program at Community College of Vermont offers more specialized concentrations:
| Concentration | Graduates |
|---|---|
| General/Allied Health Sciences | 55 |
Highest-Paying Careers for Health Sciences & Services Graduates
Those who complete Health Sciences & Services program at Community College of Vermont pursue many career paths. Below are the top-paying careers for Health Sciences & Services majors, ordered by median annual salary:
| Occupation | Nationwide Median Wage |
|---|---|
| Health Education Specialists | $81,726 |
| Community Health Workers | $73,901 |
References
- IPEDS — Integrated Postsecondary Education Data System
- U.S. Department of Education — College Scorecard
- O*NET Online (Bureau of Labor Statistics)
- National Center for Education Statistics
More about our data sources and methodologies.
HealthcareDegreeSearch.com provides higher-education, college and university, degree, program, career, salary, and other helpful information to students, faculty, institutions, and other internet audiences. Presented information and data are subject to change. Inclusion on this website does not imply or represent a direct relationship with the company, school, or brand. Information, though believed correct at time of publication, may not be correct, and no warranty is provided. Contact the schools to verify any information before relying on it. Financial aid may be available for those who qualify. The displayed options may include sponsored or recommended results, not necessarily based on your preferences.
© HealthcareDegreeSearch.com – All Rights Reserved.