Other Health & Clinical Sciences at Ferris State University
If you plan to study Other Health & Clinical Sciences, consider the program at Ferris State University. We’ve gathered the following information to help you decide.
Ferris State University sits in Big Rapids, MI.
For the most recent IPEDS reporting year, 77 other health & clinical sciences degrees were granted at Ferris State University.
Featured schools near , edit
Studying Online at Ferris State University
Online coursework is an option at Ferris State University. Among 9,959 students, 1,655 (17%) were enrolled entirely in distance education and 3,138 (32%) took at least some classes online.
Other Health & Clinical Sciences Rankings at Ferris State University
These rankings give you a sense of how Ferris State University’s Other Health & Clinical Sciences program to other colleges that offer this major.
Bachelor’s-Level Rankings
| Ranking | Scope | Rank |
|---|---|---|
| Best Value | Michigan | #2 of 8 |
| Best Schools (Quality) | Michigan | #5 of 8 |
| Best Value | Great Lakes (Region) | #5 of 24 |
| Best Schools (Quality) | Great Lakes (Region) | #15 of 23 |
| Best Value | Nationwide | #26 of 109 |
| Best Schools (Quality) | Nationwide | #74 of 111 |
Associate-Level Rankings
| Ranking | Scope | Rank |
|---|---|---|
| Best Value | Michigan | #2 of 8 |
| Best Schools (Quality) | Michigan | #5 of 8 |
| Best Value | Great Lakes (Region) | #5 of 24 |
| Best Schools (Quality) | Great Lakes (Region) | #15 of 23 |
| Best Value | Nationwide | #26 of 109 |
| Best Schools (Quality) | Nationwide | #74 of 111 |
Student Demographics & Diversity
The following sections describe the composition of Other Health & Clinical Sciences graduates at Ferris State University, by degree type.
Looking at the program as a whole, Other Health & Clinical Sciences graduates at Ferris State University are 90% women (69) and 10% men (8).
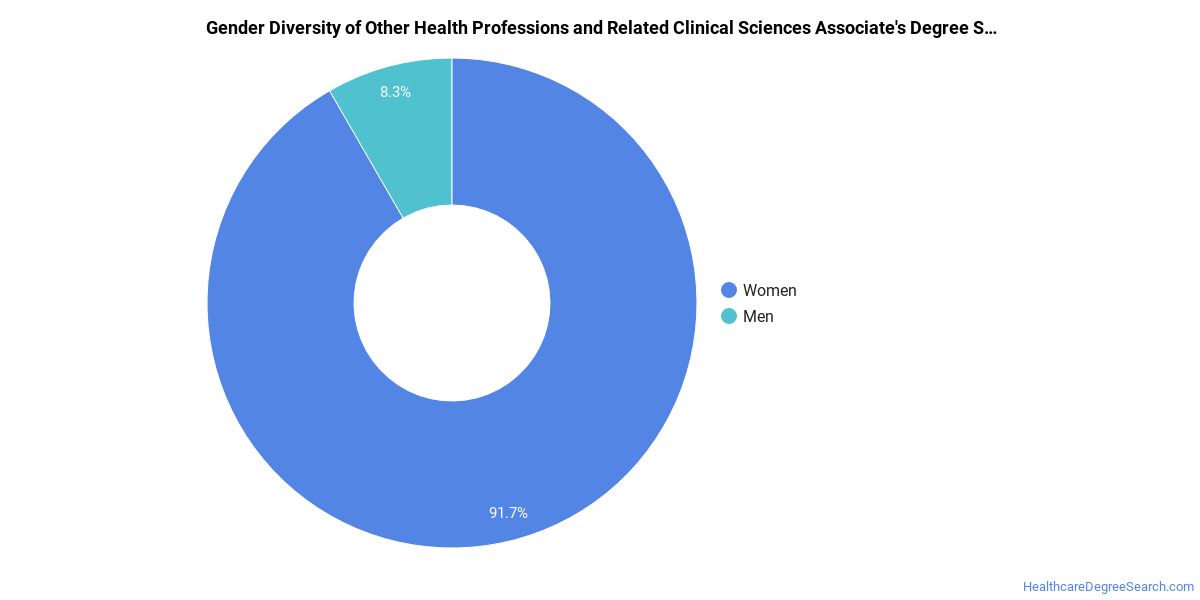
Other Health & Clinical Sciences Associate’s Program at Ferris State University
Of the 31 associate’s other health & clinical sciences degrees awarded at Ferris State University, 90% were women (28) and 10% were men (3).
The following table and chart show the race/ethnicity of Other Health & Clinical Sciences associate’s degree recipients at Ferris State University.
| Race / Ethnicity | Number of Graduates |
|---|---|
| White | 22 |
| Hispanic / Latino | 2 |
| Black / African American | 5 |
| Asian | 2 |
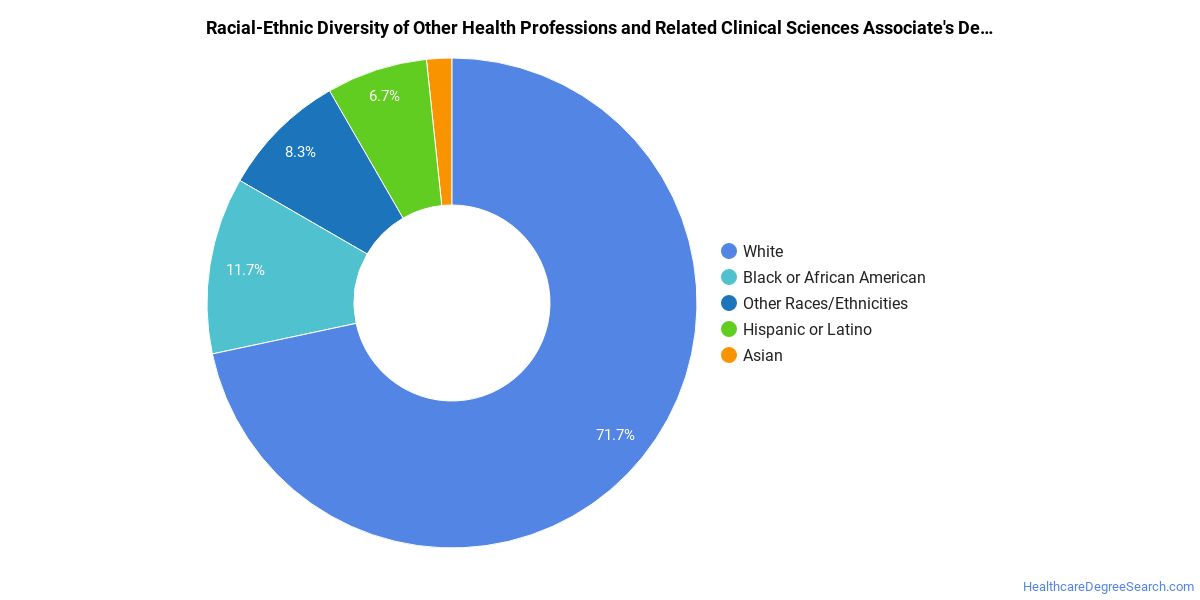
Minority students account for 29% of Other Health & Clinical Sciences associate’s degree recipients at Ferris State University, lower than the national average of 45%.*
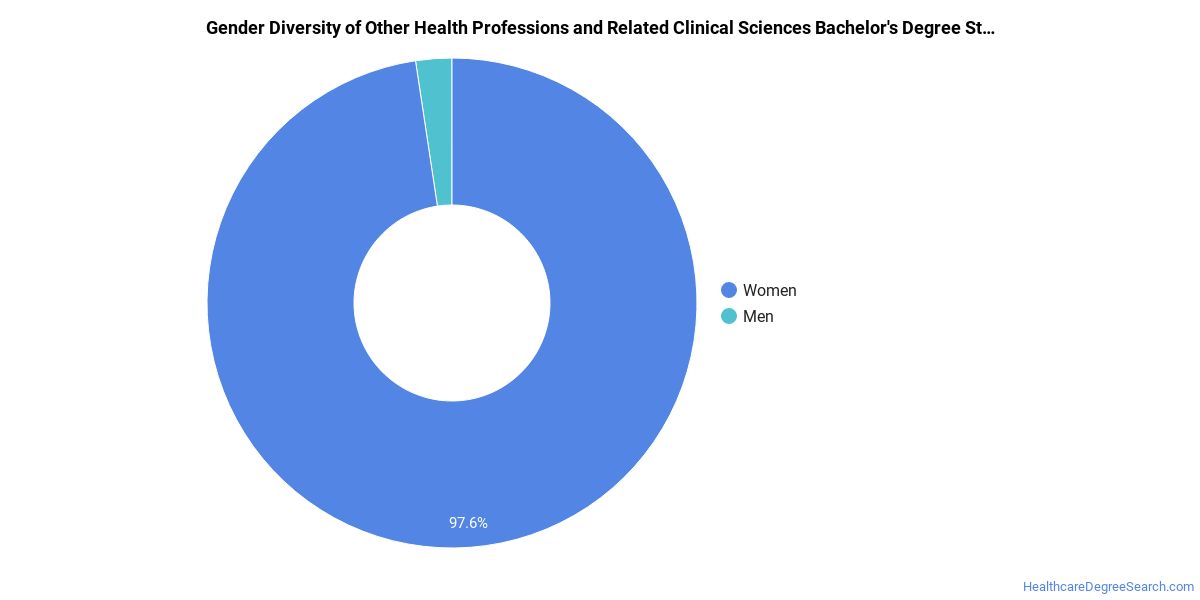
Other Health & Clinical Sciences Bachelor’s Program at Ferris State University
Among the 46 bachelor’s other health & clinical sciences graduates at Ferris State University, 89% were women (41) and 11% were men (5).
The following table and chart show the race/ethnicity of Other Health & Clinical Sciences bachelor’s degree recipients at Ferris State University.
| Race / Ethnicity | Number of Graduates |
|---|---|
| White | 43 |
| Hispanic / Latino | 1 |
| Black / African American | 1 |
| Two or More Races | 1 |
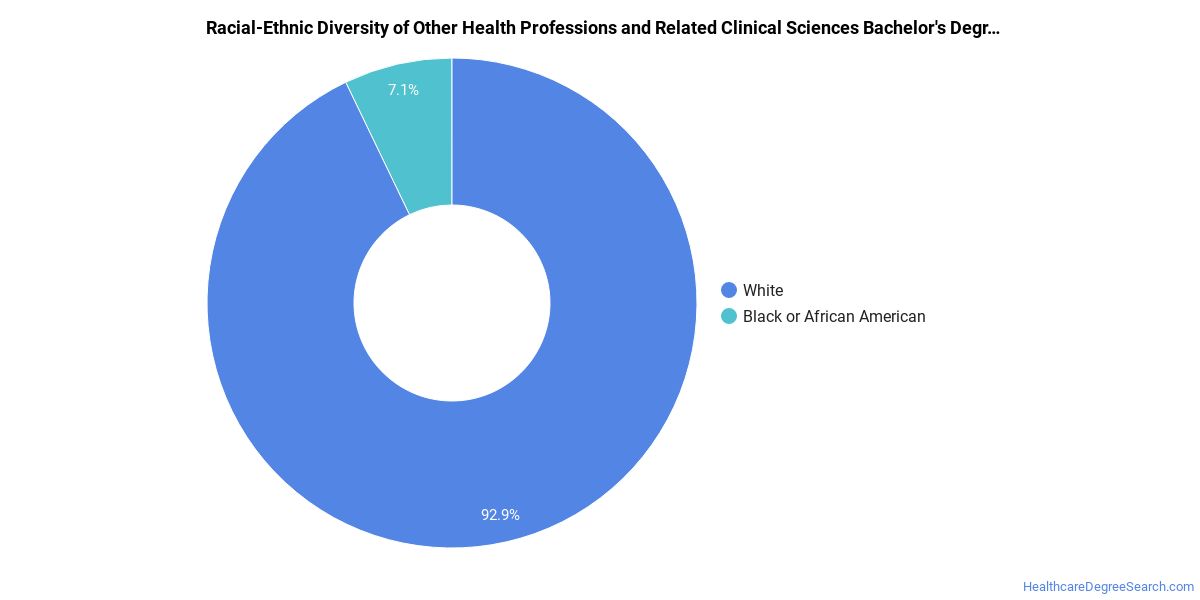
Minority students account for 7% of Other Health & Clinical Sciences bachelor’s degree recipients at Ferris State University, lower than the national average of 34%.*
*The racial-ethnic minorities figure is the total number of graduates minus White, international (nonresident), and unknown-race graduates.
References
- IPEDS — Integrated Postsecondary Education Data System
- U.S. Department of Education — College Scorecard
- O*NET Online (Bureau of Labor Statistics)
- National Center for Education Statistics
More about our data sources and methodologies.
HealthcareDegreeSearch.com provides higher-education, college and university, degree, program, career, salary, and other helpful information to students, faculty, institutions, and other internet audiences. Presented information and data are subject to change. Inclusion on this website does not imply or represent a direct relationship with the company, school, or brand. Information, though believed correct at time of publication, may not be correct, and no warranty is provided. Contact the schools to verify any information before relying on it. Financial aid may be available for those who qualify. The displayed options may include sponsored or recommended results, not necessarily based on your preferences.
© HealthcareDegreeSearch.com – All Rights Reserved.