Health/Medical Preparatory Programs at Kent State University at Kent
What traits are you looking for in a school for Health/Medical Preparatory Programs, consider the program at Kent State University at Kent. Get started with the following essential facts.
Kent State University at Kent sits in Kent, OH.
During the most recent reporting year, 19 health/medical preparatory programs degrees were granted at Kent State University at Kent.
Featured schools near , edit
Online Class Availability at Kent State University at Kent
Many students take online classes at Kent State University at Kent. Among 26,374 students, 4,457 (17%) were enrolled entirely in distance education and 12,660 (48%) took at least some classes online.
Health/Medical Preparatory Programs Rankings at Kent State University at Kent
Use these rankings to compare Kent State University at Kent’s Health/Medical Preparatory Programs program against peer institutions.
Bachelor’s-Level Rankings
| Ranking | Scope | Rank |
|---|---|---|
| Best Schools (Quality) | Ohio | #2 of 4 |
| Best Value | Ohio | #4 of 5 |
| Best Schools (Quality) | Great Lakes (Region) | #8 of 11 |
| Best Value | Great Lakes (Region) | #11 of 14 |
| Best Schools (Quality) | Nationwide | #34 of 59 |
| Best Value | Nationwide | #47 of 72 |
Student Demographics & Diversity
Take a look at the student demographics for Health/Medical Preparatory Programs graduates at Kent State University at Kent, broken down by degree level.
Across all degree levels, Health/Medical Preparatory Programs graduates at Kent State University at Kent are 79% women (15) and 21% men (4).
Health/Medical Preparatory Programs Bachelor’s Program at Kent State University at Kent
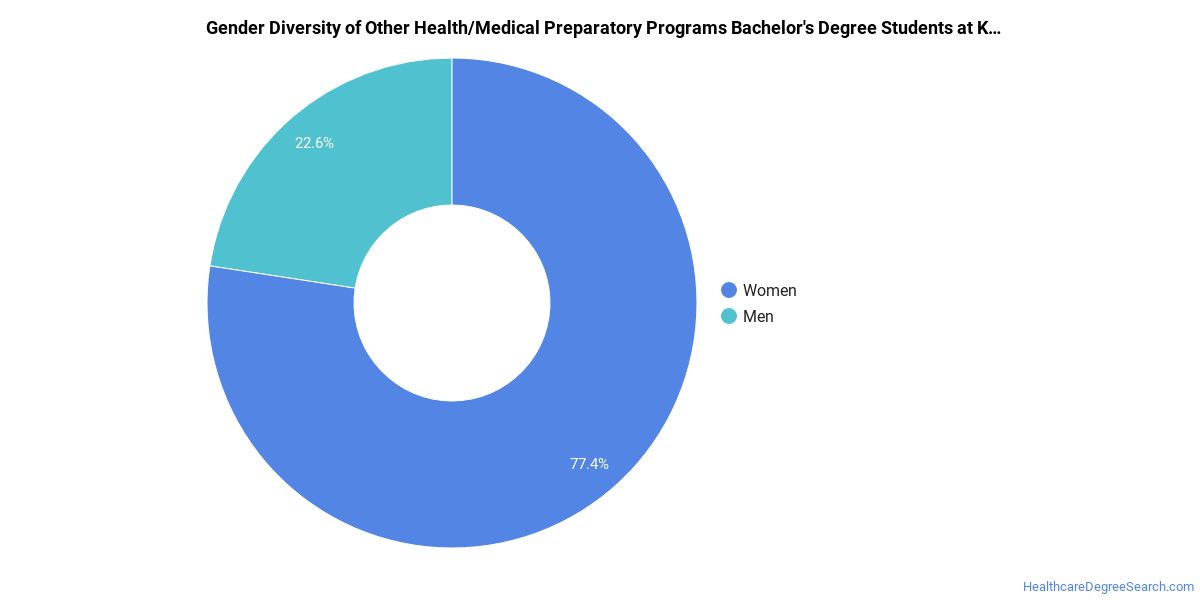
Of the 18 bachelor’s health/medical preparatory programs graduates at Kent State University at Kent, 78% were women (14) and 22% were men (4).
The following table and chart show the race/ethnicity of Health/Medical Preparatory Programs bachelor’s degree recipients at Kent State University at Kent.
| Race / Ethnicity | Number of Graduates |
|---|---|
| White | 13 |
| Hispanic / Latino | 1 |
| Black / African American | 3 |
| Two or More Races | 1 |
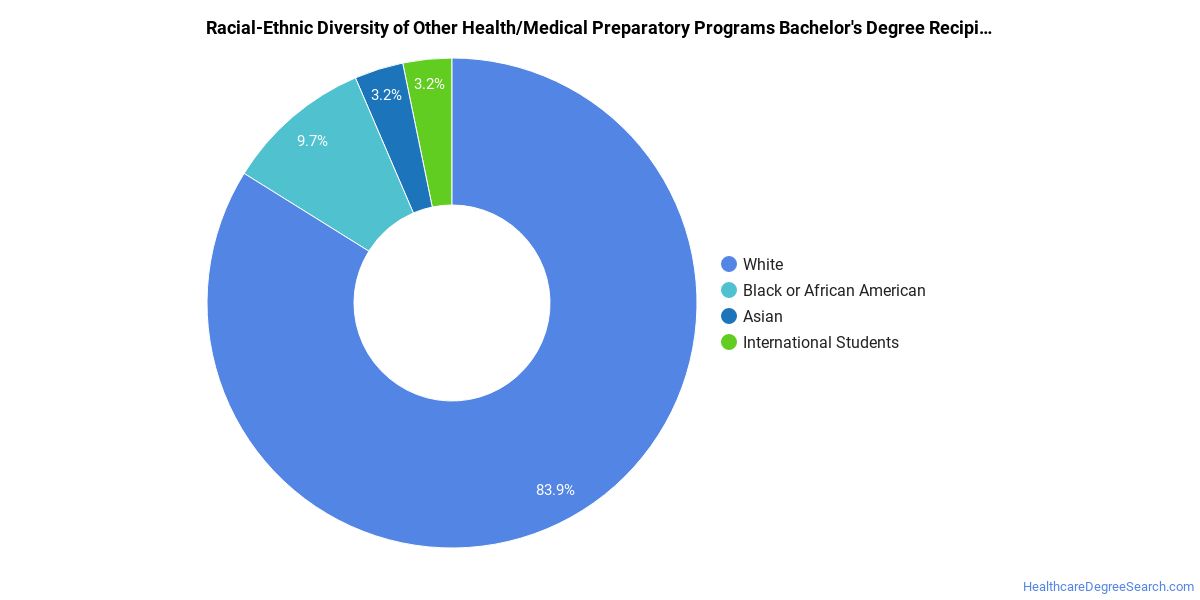
Minority students account for 28% of Health/Medical Preparatory Programs bachelor’s degree recipients at Kent State University at Kent, lower than the national average of 40%.*
*The racial-ethnic minorities figure is the total number of graduates minus White, international (nonresident), and unknown-race graduates.
References
- IPEDS — Integrated Postsecondary Education Data System
- U.S. Department of Education — College Scorecard
- O*NET Online (Bureau of Labor Statistics)
- National Center for Education Statistics
More about our data sources and methodologies.
HealthcareDegreeSearch.com provides higher-education, college and university, degree, program, career, salary, and other helpful information to students, faculty, institutions, and other internet audiences. Presented information and data are subject to change. Inclusion on this website does not imply or represent a direct relationship with the company, school, or brand. Information, though believed correct at time of publication, may not be correct, and no warranty is provided. Contact the schools to verify any information before relying on it. Financial aid may be available for those who qualify. The displayed options may include sponsored or recommended results, not necessarily based on your preferences.
© HealthcareDegreeSearch.com – All Rights Reserved.