Other Mental Health Services at Lackawanna College
If you are interested in studying Other Mental Health Services, consider the program at Lackawanna College. Get started with the following essential facts.
Lackawanna College is in Scranton, PA.
During the most recent reporting year, 74 other mental health services degrees were awarded at Lackawanna College.
Featured schools near , edit
Online & Distance Learning at Lackawanna College
Online coursework is an option at Lackawanna College. Among 2,211 students, 646 (29%) studied exclusively online and 887 (40%) took at least some classes online.
Other Mental Health Services Rankings at Lackawanna College
Rankings can help you compare Lackawanna College’s Other Mental Health Services program against peer institutions.
Bachelor’s-Level Rankings
| Ranking | Scope | Rank |
|---|---|---|
| Best Schools (Quality) | Pennsylvania | #1 of 1 |
| Best Value | Pennsylvania | #2 of 2 |
| Best Schools (Quality) | Middle Atlantic (Region) | #7 of 7 |
| Best Value | Middle Atlantic (Region) | #7 of 9 |
| Best Schools (Quality) | Nationwide | #51 of 55 |
| Best Value | Nationwide | #85 of 92 |
Associate-Level Rankings
| Ranking | Scope | Rank |
|---|---|---|
| Best Schools (Quality) | Pennsylvania | #1 of 1 |
| Best Value | Pennsylvania | #2 of 2 |
| Best Schools (Quality) | Middle Atlantic (Region) | #7 of 7 |
| Best Value | Middle Atlantic (Region) | #7 of 9 |
| Best Schools (Quality) | Nationwide | #51 of 55 |
| Best Value | Nationwide | #85 of 92 |
Student Demographics & Diversity
Below you’ll find the student demographics for Other Mental Health Services graduates at Lackawanna College, by degree type.
Across all degree levels, Other Mental Health Services graduates at Lackawanna College are 68% women (50) and 32% men (24).
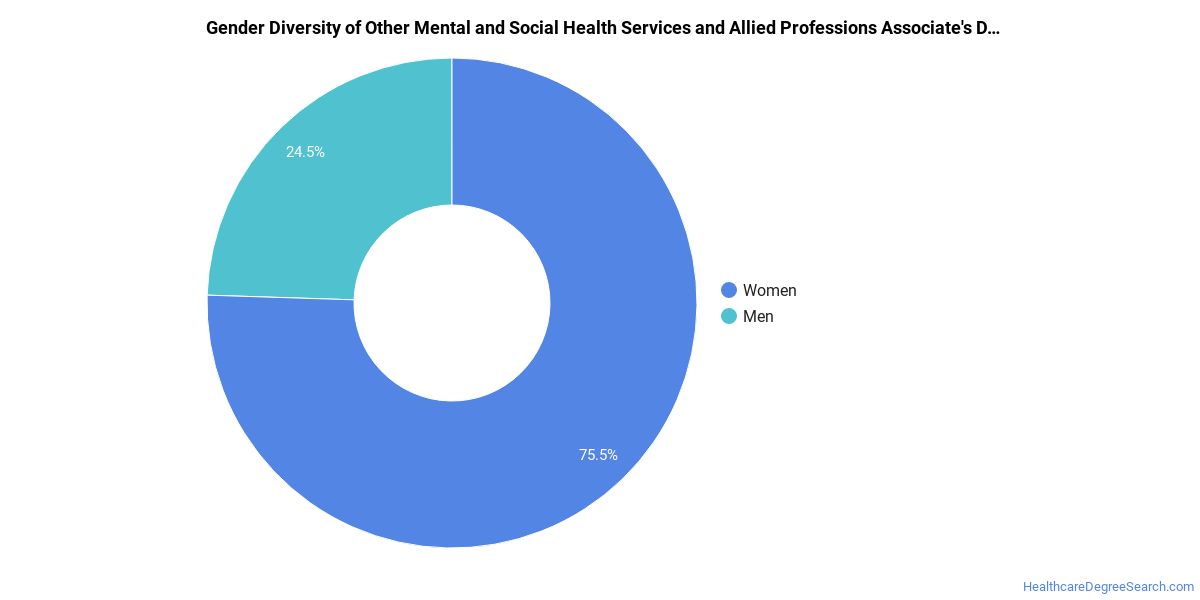
Other Mental Health Services Associate’s Program at Lackawanna College
Among the 49 associate’s other mental health services graduates at Lackawanna College, 92% were women (45) and 8% were men (4).
The following table and chart show the race/ethnicity of Other Mental Health Services associate’s degree recipients at Lackawanna College.
| Race / Ethnicity | Number of Graduates |
|---|---|
| White | 30 |
| Hispanic / Latino | 7 |
| Two or More Races | 2 |
| International (Nonresident) | 1 |
| Unknown | 9 |
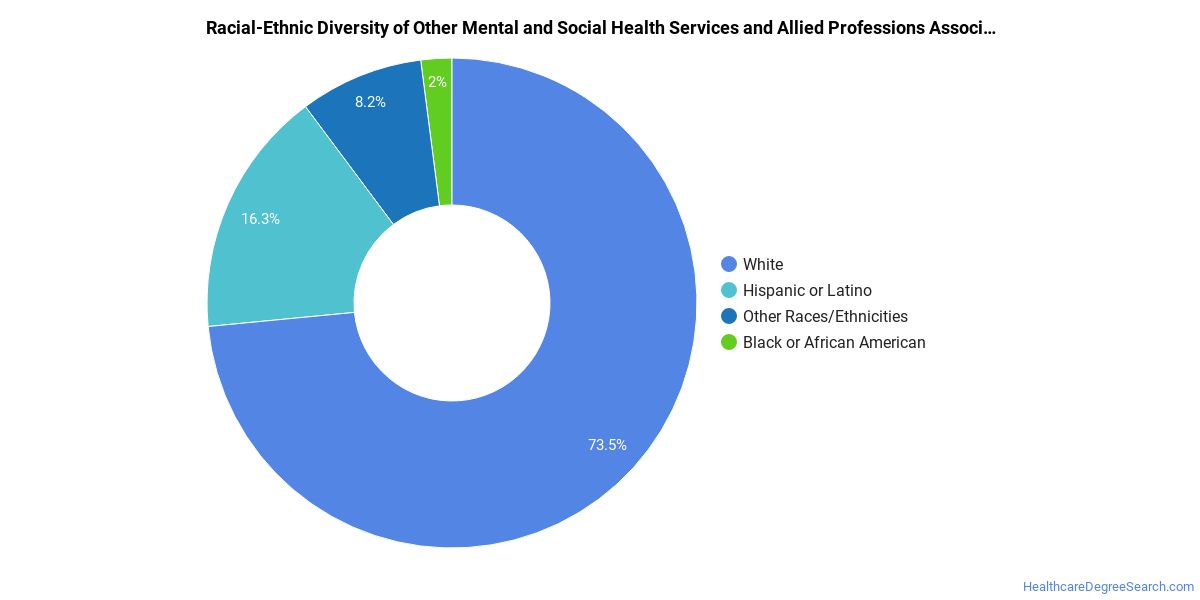
Racial-ethnic minorities make up 18% of Other Mental Health Services associate’s degree recipients at Lackawanna College, below the national average of 48%.*
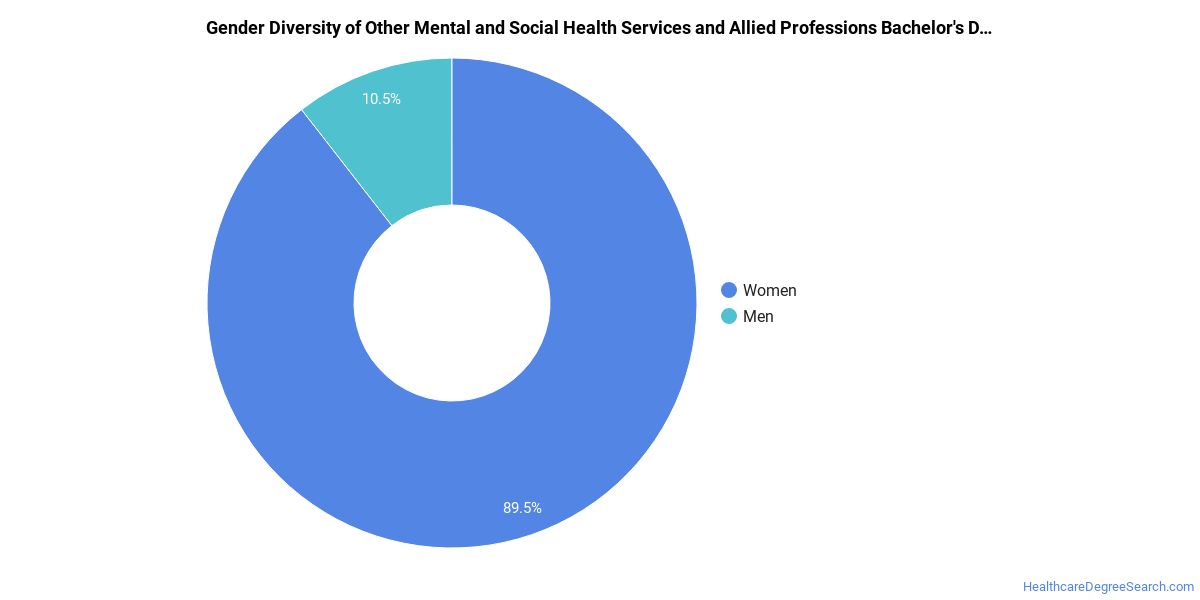
Other Mental Health Services Bachelor’s Program at Lackawanna College
Of the 25 bachelor’s other mental health services graduates at Lackawanna College, 20% were women (5) and 80% were men (20).
The following table and chart show the race/ethnicity of Other Mental Health Services bachelor’s degree recipients at Lackawanna College.
| Race / Ethnicity | Number of Graduates |
|---|---|
| White | 15 |
| Hispanic / Latino | 2 |
| Black / African American | 2 |
| Two or More Races | 1 |
| Unknown | 5 |
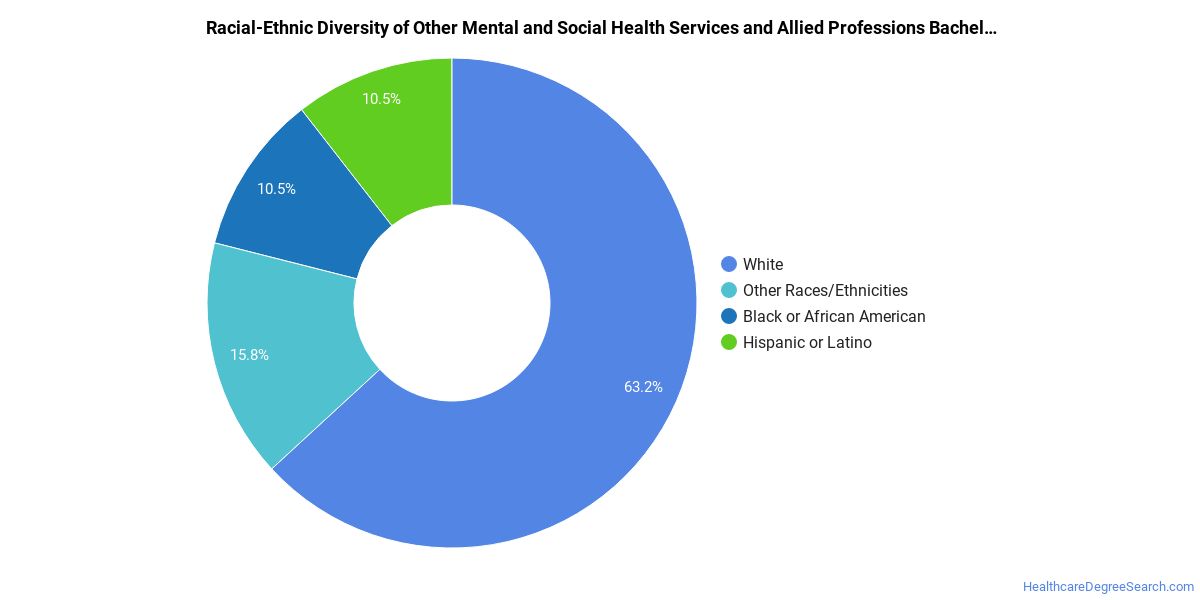
Racial-ethnic minorities make up 20% of Other Mental Health Services bachelor’s degree recipients at Lackawanna College, below the national average of 56%.*
*The racial-ethnic minorities figure is the total number of graduates minus White, international (nonresident), and unknown-race graduates.
References
- IPEDS — Integrated Postsecondary Education Data System
- U.S. Department of Education — College Scorecard
- O*NET Online (Bureau of Labor Statistics)
- National Center for Education Statistics
More about our data sources and methodologies.
HealthcareDegreeSearch.com provides higher-education, college and university, degree, program, career, salary, and other helpful information to students, faculty, institutions, and other internet audiences. Presented information and data are subject to change. Inclusion on this website does not imply or represent a direct relationship with the company, school, or brand. Information, though believed correct at time of publication, may not be correct, and no warranty is provided. Contact the schools to verify any information before relying on it. Financial aid may be available for those who qualify. The displayed options may include sponsored or recommended results, not necessarily based on your preferences.
© HealthcareDegreeSearch.com – All Rights Reserved.