Communication Sciences & Disorders at Lebanon Valley College
If you are interested in studying Communication Sciences & Disorders, you may want to check out the program at Lebanon Valley College. We’ve gathered the following information to help you decide.
Lebanon Valley College is in Annville, PA.
During the most recent reporting year, 29 communication sciences & disorders degrees were granted at Lebanon Valley College.
Featured schools near , edit
Online & Distance Learning at Lebanon Valley College
Many students take online classes at Lebanon Valley College. Among 2,146 students, 192 (9%) studied exclusively online and 573 (27%) took at least some classes online.
Student Demographics & Diversity
The following sections describe the student demographics for Communication Sciences & Disorders graduates at Lebanon Valley College, by degree type.
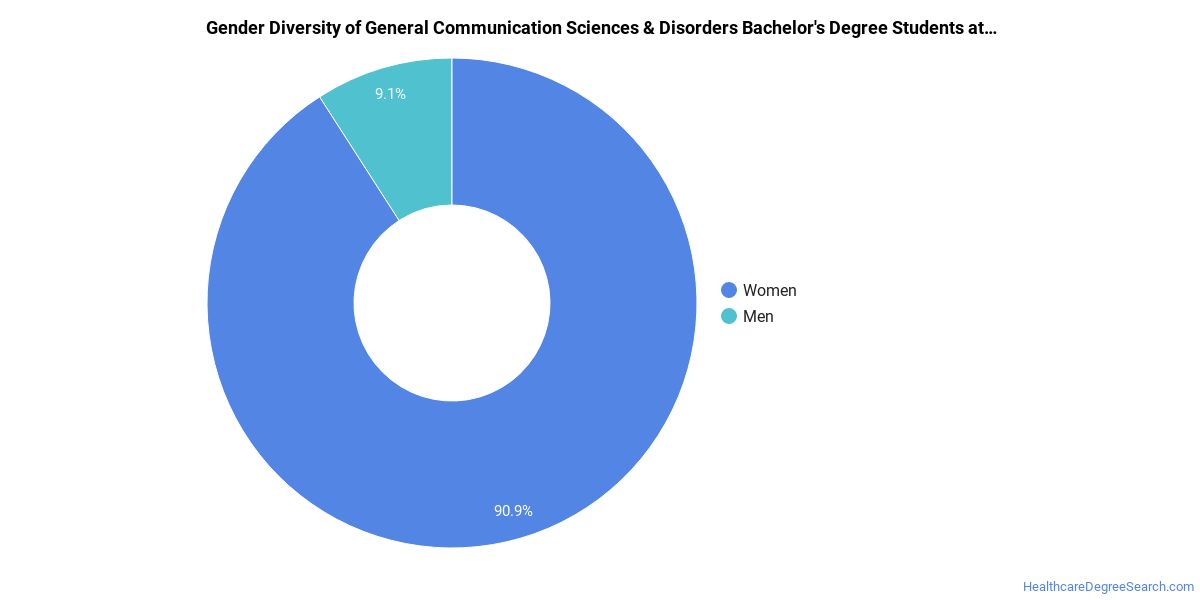
Program-wide, Communication Sciences & Disorders graduates at Lebanon Valley College are 97% women (28) and 3% men (1).
Communication Sciences & Disorders Bachelor’s Program at Lebanon Valley College
Among the 29 bachelor’s communication sciences & disorders graduates at Lebanon Valley College, 97% were women (28) and 3% were men (1).
The following table and chart show the race/ethnicity of Communication Sciences & Disorders bachelor’s degree recipients at Lebanon Valley College.
| Race / Ethnicity | Number of Graduates |
|---|---|
| White | 24 |
| Hispanic / Latino | 3 |
| Asian | 1 |
| Two or More Races | 1 |
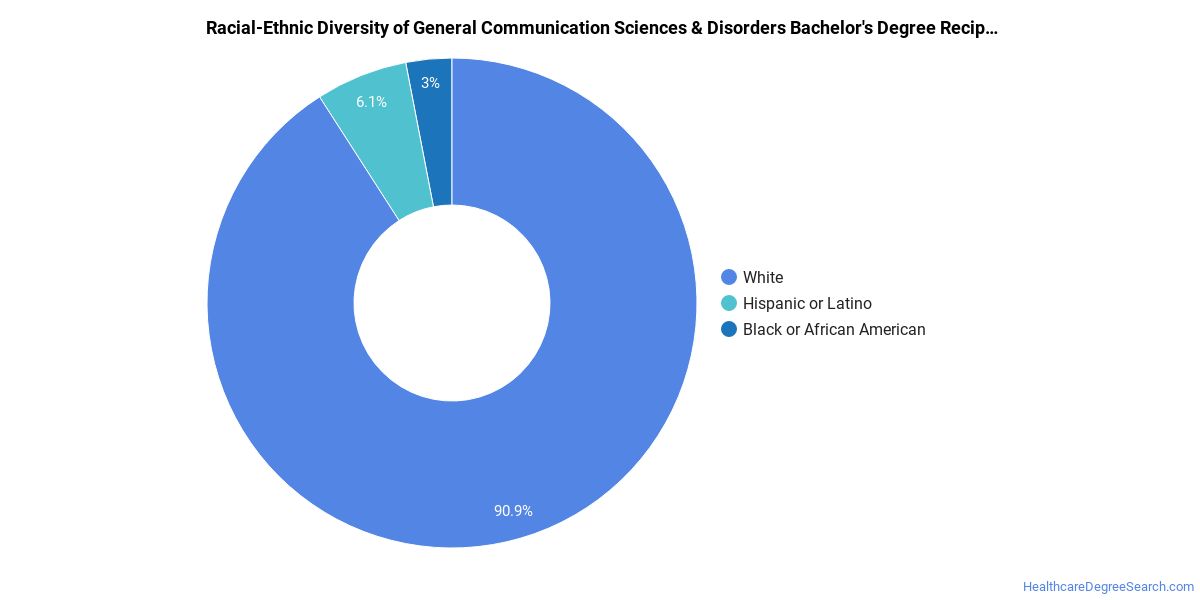
Minority students account for 17% of Communication Sciences & Disorders bachelor’s degree recipients at Lebanon Valley College, lower than the national average of 38%.*
*The racial-ethnic minorities figure is the total number of graduates minus White, international (nonresident), and unknown-race graduates.
Highest-Paying Careers for Communication Sciences & Disorders Graduates
Graduates of the Communication Sciences & Disorders program at Lebanon Valley College go on to a range of careers. Below are the best-paid careers for Communication Sciences & Disorders graduates, ordered by median annual salary:
| Occupation | Nationwide Median Wage |
|---|---|
| Audiologists | $54,746 |
| Speech-Language Pathologists | $47,305 |
| Health Specialties Teachers, Postsecondary | $46,663 |
References
- IPEDS — Integrated Postsecondary Education Data System
- U.S. Department of Education — College Scorecard
- O*NET Online (Bureau of Labor Statistics)
- National Center for Education Statistics
More about our data sources and methodologies.
HealthcareDegreeSearch.com provides higher-education, college and university, degree, program, career, salary, and other helpful information to students, faculty, institutions, and other internet audiences. Presented information and data are subject to change. Inclusion on this website does not imply or represent a direct relationship with the company, school, or brand. Information, though believed correct at time of publication, may not be correct, and no warranty is provided. Contact the schools to verify any information before relying on it. Financial aid may be available for those who qualify. The displayed options may include sponsored or recommended results, not necessarily based on your preferences.
© HealthcareDegreeSearch.com – All Rights Reserved.