Health/Medical Prep Programs at Lee University
What traits are you looking for in a school for Health/Medical Prep Programs, you may want to check out the program at Lee University. Get started with the following essential facts.
Lee University is in Cleveland, TN.
During the most recent reporting year, 14 health/medical prep programs graduations were recorded at Lee University.
Featured schools near , edit
Online & Distance Learning at Lee University
Many students take online classes at Lee University. Among 3,714 students, 358 (10%) studied exclusively online and 401 (11%) took at least some classes online.
Health/Medical Prep Programs Rankings at Lee University
These rankings give you a sense of how Lee University’s Health/Medical Prep Programs program to other colleges that offer this major.
Bachelor’s-Level Rankings
| Ranking | Scope | Rank |
|---|---|---|
| Best Schools (Quality) | Tennessee | #2 of 4 |
| Best Value | Tennessee | #4 of 4 |
| Best Schools (Quality) | Southeast (Region) | #10 of 34 |
| Best Value | Southeast (Region) | #24 of 36 |
| Best Schools (Quality) | Nationwide | #67 of 143 |
| Best Value | Nationwide | #85 of 144 |
Earnings for Health/Medical Prep Programs Graduates from Lee University
Graduates of Lee University’s Health/Medical Prep Programs program earn the following amounts (per the U.S. Department of Education’s College Scorecard):

| Years After Graduation | Median Earnings |
|---|---|
| 2 years | $28,960 |
| 4 years | $65,665 |
| 5 years | $76,759 |
Is this above or below average for the school? At the four-year mark, Health/Medical Prep Programs graduates from Lee University earn a median of $65,665, compared with $44,103 for all Lee University graduates — about 49% higher than the school-wide median.

Student Demographics & Diversity
Below you’ll find the composition of Health/Medical Prep Programs graduates at Lee University, broken down by degree level.
Program-wide, Health/Medical Prep Programs graduates at Lee University are 57% women (8) and 43% men (6).
Health/Medical Prep Programs Bachelor’s Program at Lee University
Among the 14 bachelor’s health/medical prep programs degrees awarded at Lee University, 57% were women (8) and 43% were men (6).

The following table and chart show the race/ethnicity of Health/Medical Prep Programs bachelor’s degree recipients at Lee University.
| Race / Ethnicity | Number of Graduates |
|---|---|
| White | 13 |
| Two or More Races | 1 |
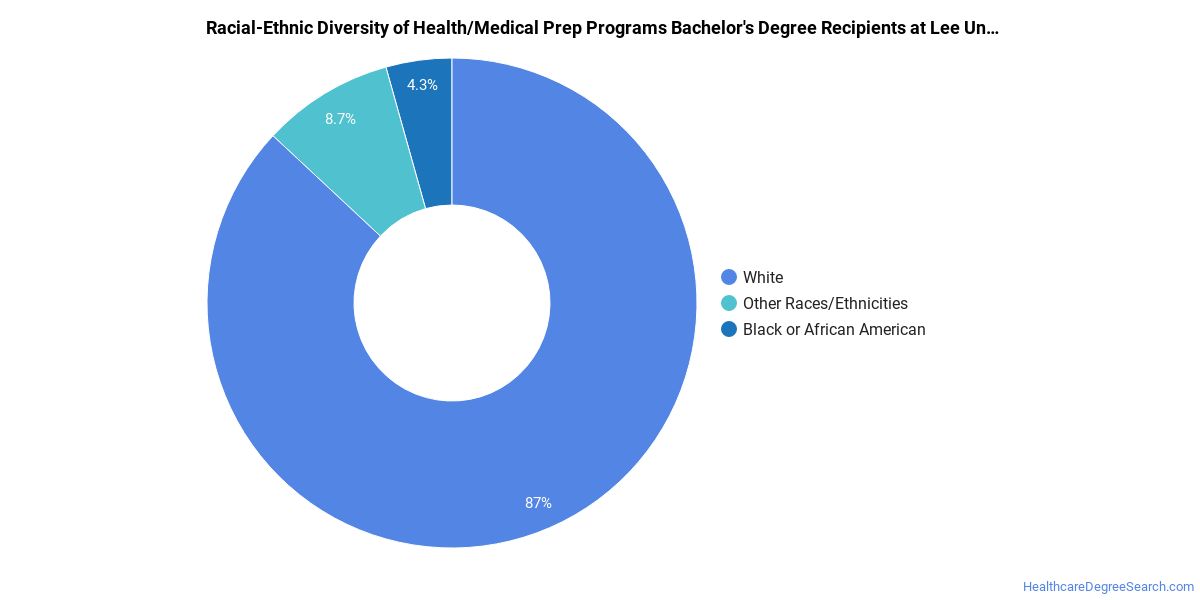
Minority students account for 7% of Health/Medical Prep Programs bachelor’s degree recipients at Lee University, lower than the national average of 39%.*
*The racial-ethnic minorities figure is the total number of graduates minus White, international (nonresident), and unknown-race graduates.
More Specific Health/Medical Prep Programs Concentrations at Lee University
This Health/Medical Prep Programs program at Lee University breaks down into more specific concentrations:
| Concentration | Graduates |
|---|---|
| Pre-Physical Therapy Studies | 4 |
| Pre-Physician Assistant. | 4 |
| Health/Medical Preparatory Programs | 6 |
References
- IPEDS — Integrated Postsecondary Education Data System
- U.S. Department of Education — College Scorecard
- O*NET Online (Bureau of Labor Statistics)
- National Center for Education Statistics
More about our data sources and methodologies.
HealthcareDegreeSearch.com provides higher-education, college and university, degree, program, career, salary, and other helpful information to students, faculty, institutions, and other internet audiences. Presented information and data are subject to change. Inclusion on this website does not imply or represent a direct relationship with the company, school, or brand. Information, though believed correct at time of publication, may not be correct, and no warranty is provided. Contact the schools to verify any information before relying on it. Financial aid may be available for those who qualify. The displayed options may include sponsored or recommended results, not necessarily based on your preferences.
© HealthcareDegreeSearch.com – All Rights Reserved.