Health Sciences & Services at Lehigh Carbon Community College
If you plan to study Health Sciences & Services, consider the program at Lehigh Carbon Community College. We’ve gathered the following information to help you decide.
Lehigh Carbon Community College is located in Schnecksville, PA.
For the most recent IPEDS reporting year, 51 health sciences & services degrees were granted at Lehigh Carbon Community College.
Featured schools near , edit
Studying Online at Lehigh Carbon Community College
Many students take online classes at Lehigh Carbon Community College. Among 6,221 students, 1,816 (29%) were enrolled entirely in distance education and 1,810 (29%) took at least some classes online.
Health Sciences & Services Rankings at Lehigh Carbon Community College
These rankings give you a sense of how Lehigh Carbon Community College’s Health Sciences & Services program to other colleges that offer this major.
Associate-Level Rankings
| Ranking | Scope | Rank |
|---|---|---|
| Best Value | Pennsylvania | #3 of 24 |
| Best Schools (Quality) | Pennsylvania | #12 of 24 |
| Best Value | Middle Atlantic (Region) | #20 of 84 |
| Best Schools (Quality) | Middle Atlantic (Region) | #43 of 86 |
| Best Value | Nationwide | #139 of 471 |
| Best Schools (Quality) | Nationwide | #170 of 478 |
Median Debt at Graduation
Typical debt at graduation for Health Sciences & Services graduates from Lehigh Carbon Community College comes in at $11,000.
Student Demographics & Diversity
Take a look at the student demographics for Health Sciences & Services graduates at Lehigh Carbon Community College, broken down by degree level.
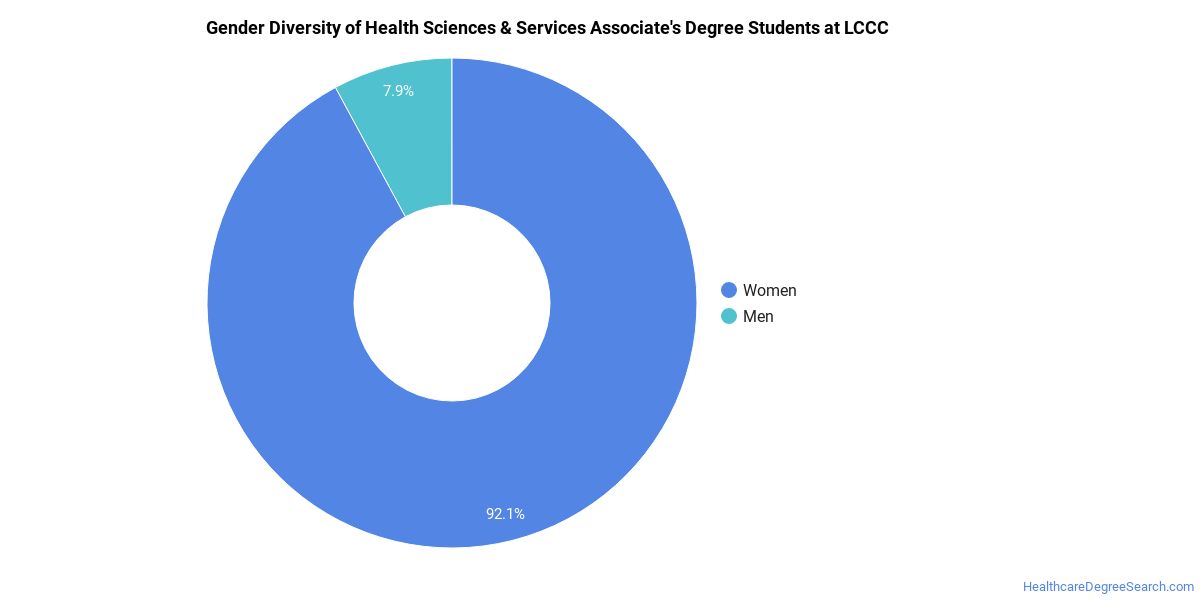
Looking at the program as a whole, Health Sciences & Services graduates at Lehigh Carbon Community College are 71% women (36) and 29% men (15).
Health Sciences & Services Associate’s Program at Lehigh Carbon Community College
Among the 51 associate’s health sciences & services graduates at Lehigh Carbon Community College, 71% were women (36) and 29% were men (15).
The following table and chart show the race/ethnicity of Health Sciences & Services associate’s degree recipients at Lehigh Carbon Community College.
| Race / Ethnicity | Number of Graduates |
|---|---|
| White | 30 |
| Hispanic / Latino | 10 |
| Black / African American | 5 |
| Asian | 3 |
| American Indian / Alaska Native | 1 |
| Two or More Races | 1 |
| Unknown | 1 |
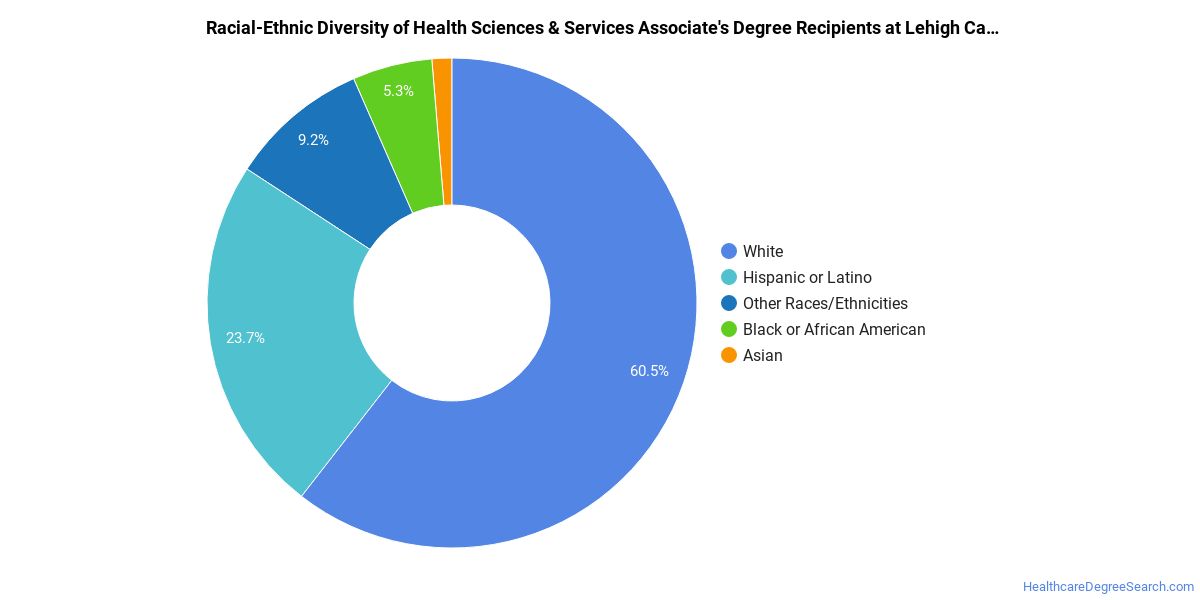
Racial-ethnic minorities make up 39% of Health Sciences & Services associate’s degree recipients at Lehigh Carbon Community College, below the national average of 65%.*
*The racial-ethnic minorities figure is the total number of graduates minus White, international (nonresident), and unknown-race graduates.
More Specific Health Sciences & Services Concentrations at Lehigh Carbon Community College
This Health Sciences & Services program at Lehigh Carbon Community College includes the following sub-specializations:
| Concentration | Graduates |
|---|---|
| General/Allied Health Sciences | 51 |
Top-Paying Careers for Health Sciences & Services Graduates
Students who finish Health Sciences & Services program at Lehigh Carbon Community College pursue many career paths. The table below ranks the best-paid careers for Health Sciences & Services majors, ordered by median annual salary:
| Occupation | Nationwide Median Wage |
|---|---|
| Health Education Specialists | $81,726 |
| Community Health Workers | $73,901 |
References
- IPEDS — Integrated Postsecondary Education Data System
- U.S. Department of Education — College Scorecard
- O*NET Online (Bureau of Labor Statistics)
- National Center for Education Statistics
More about our data sources and methodologies.
HealthcareDegreeSearch.com provides higher-education, college and university, degree, program, career, salary, and other helpful information to students, faculty, institutions, and other internet audiences. Presented information and data are subject to change. Inclusion on this website does not imply or represent a direct relationship with the company, school, or brand. Information, though believed correct at time of publication, may not be correct, and no warranty is provided. Contact the schools to verify any information before relying on it. Financial aid may be available for those who qualify. The displayed options may include sponsored or recommended results, not necessarily based on your preferences.
© HealthcareDegreeSearch.com – All Rights Reserved.