Other Mental Health Services at Liberty University
What traits are you looking for in a school for Other Mental Health Services, consider the program at Liberty University. Get started with the following essential facts.
Liberty University is in Lynchburg, VA.
For the most recent IPEDS reporting year, 714 other mental health services degrees were awarded at Liberty University.
Featured schools near , edit
Online Class Availability at Liberty University
Many students take online classes at Liberty University. Among 104,327 students, 88,309 (85%) were enrolled entirely in distance education and 7,616 (7%) took at least some classes online.
Other Mental Health Services Rankings at Liberty University
Rankings can help you compare Liberty University’s Other Mental Health Services program against peer institutions.
Master’s-Level Rankings
| Ranking | Scope | Rank |
|---|---|---|
| Best Schools (Quality) | Virginia | #7 of 10 |
| Best Value | Virginia | #15 of 15 |
| Best Schools (Quality) | Southeast (Region) | #26 of 31 |
| Best Value | Southeast (Region) | #42 of 42 |
| Best Schools (Quality) | Nationwide | #47 of 55 |
| Best Value | Nationwide | #90 of 92 |
Student Demographics & Diversity
The following sections describe the composition of Other Mental Health Services graduates at Liberty University, by degree type.
Program-wide, Other Mental Health Services graduates at Liberty University are 80% women (570) and 20% men (144).
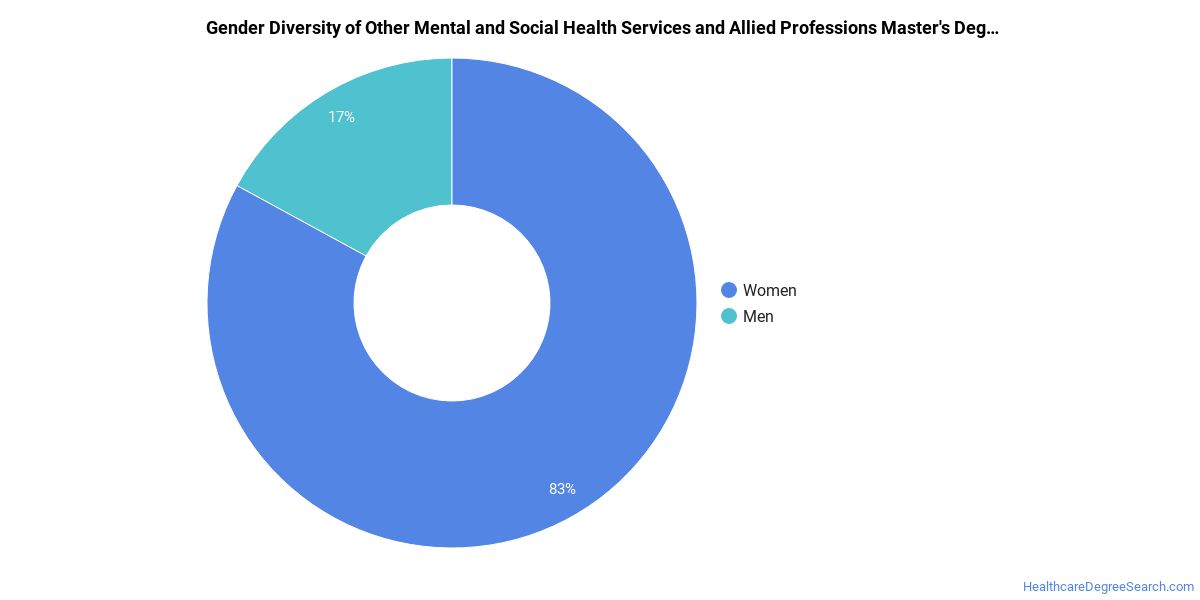
Other Mental Health Services Master’s Program at Liberty University
Of the 703 master’s other mental health services degrees awarded at Liberty University, 80% were women (563) and 20% were men (140).
The following table and chart show the race/ethnicity of Other Mental Health Services master’s degree recipients at Liberty University.
| Race / Ethnicity | Number of Graduates |
|---|---|
| White | 325 |
| Hispanic / Latino | 53 |
| Black / African American | 169 |
| Asian | 9 |
| American Indian / Alaska Native | 3 |
| Native Hawaiian / Pacific Islander | 2 |
| Two or More Races | 20 |
| International (Nonresident) | 5 |
| Unknown | 117 |
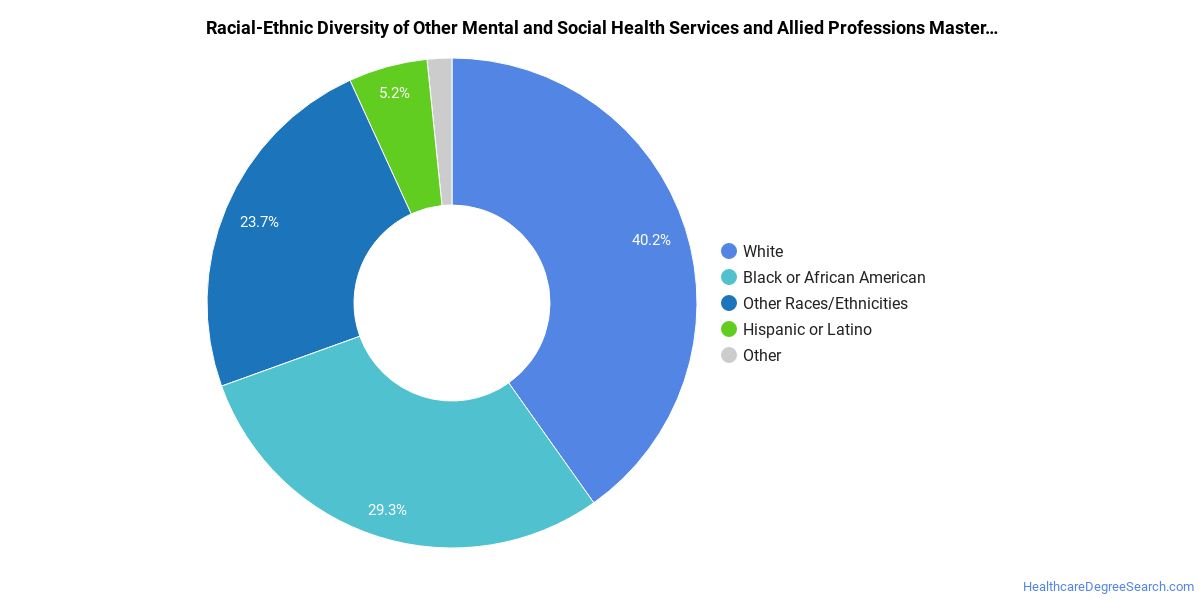
Racial-ethnic minorities make up 36% of Other Mental Health Services master’s degree recipients at Liberty University, below the national average of 42%.*
*The racial-ethnic minorities figure is the total number of graduates minus White, international (nonresident), and unknown-race graduates.
References
- IPEDS — Integrated Postsecondary Education Data System
- U.S. Department of Education — College Scorecard
- O*NET Online (Bureau of Labor Statistics)
- National Center for Education Statistics
More about our data sources and methodologies.
HealthcareDegreeSearch.com provides higher-education, college and university, degree, program, career, salary, and other helpful information to students, faculty, institutions, and other internet audiences. Presented information and data are subject to change. Inclusion on this website does not imply or represent a direct relationship with the company, school, or brand. Information, though believed correct at time of publication, may not be correct, and no warranty is provided. Contact the schools to verify any information before relying on it. Financial aid may be available for those who qualify. The displayed options may include sponsored or recommended results, not necessarily based on your preferences.
© HealthcareDegreeSearch.com – All Rights Reserved.