Health Sciences & Services at Life University
What traits are you looking for in a school for Health Sciences & Services, consider the program at Life University. We’ve gathered the following information to help you decide.
Life University sits in Marietta, GA.
In the most recent year for which we have data, 1 health sciences & services degrees were awarded at Life University.
Featured schools near , edit
Online & Distance Learning at Life University
Distance learning is available at Life University. Of 2,714 students, 281 (10%) studied exclusively online and 1,709 (63%) took at least some classes online.
Health Sciences & Services Rankings at Life University
These rankings give you a sense of how Life University’s Health Sciences & Services program to other colleges that offer this major.
Bachelor’s-Level Rankings
| Ranking | Scope | Rank |
|---|---|---|
| Best Schools (Quality) | Georgia | #None of 15 |
| Best Schools (Quality) | Southeast (Region) | #None of 105 |
| Best Schools (Quality) | Nationwide | #None of 478 |
| Best Value | Georgia | #None of 16 |
| Best Value | Southeast (Region) | #None of 106 |
| Best Value | Nationwide | #None of 471 |
Associate-Level Rankings
| Ranking | Scope | Rank |
|---|---|---|
| Best Schools (Quality) | Georgia | #None of 15 |
| Best Schools (Quality) | Southeast (Region) | #None of 105 |
| Best Schools (Quality) | Nationwide | #None of 478 |
| Best Value | Georgia | #None of 16 |
| Best Value | Southeast (Region) | #None of 106 |
| Best Value | Nationwide | #None of 471 |
Student Demographics & Diversity
Take a look at the student demographics for Health Sciences & Services graduates at Life University, broken down by degree level.
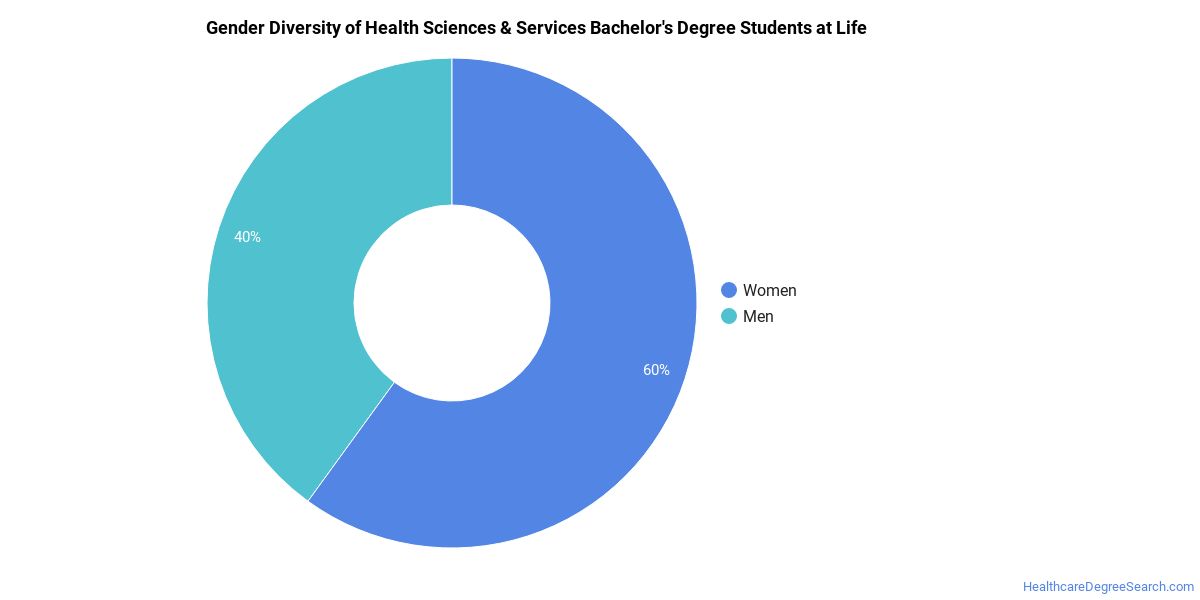
Program-wide, Health Sciences & Services graduates at Life University are 100% women (1) and 0% men (0).
Health Sciences & Services Bachelor’s Program at Life University
Of the 1 bachelor’s health sciences & services degrees awarded at Life University, 100% were women (1) and 0% were men (0).
The following table and chart show the race/ethnicity of Health Sciences & Services bachelor’s degree recipients at Life University.
| Race / Ethnicity | Number of Graduates |
|---|---|
| Hispanic / Latino | 1 |
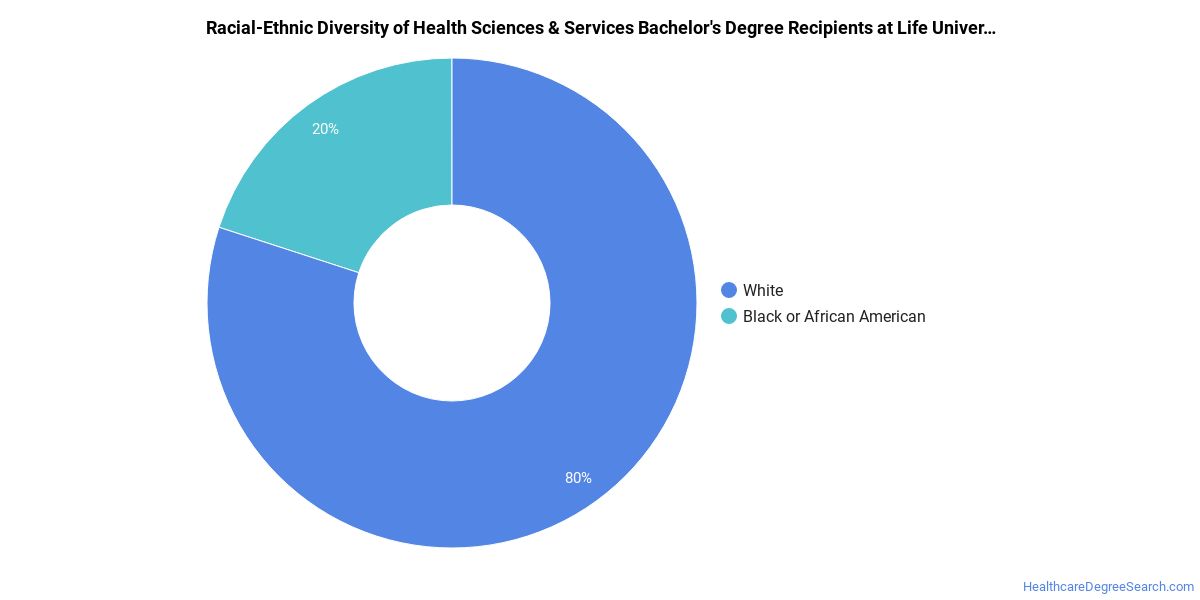
Minority students account for 100% of Health Sciences & Services bachelor’s degree recipients at Life University, above the national average of 50%.*
*The racial-ethnic minorities figure is the total number of graduates minus White, international (nonresident), and unknown-race graduates.
More Specific Health Sciences & Services Concentrations at Life University
This Health Sciences & Services program at Life University offers more specialized concentrations:
| Concentration | Graduates |
|---|---|
| General Health & Wellness | 1 |
Highest-Paying Careers for Health Sciences & Services Graduates
Graduates of the Health Sciences & Services program at Life University pursue many career paths. The table below ranks the highest-paying careers for Health Sciences & Services graduates, ordered by median annual salary:
| Occupation | Nationwide Median Wage |
|---|---|
| Health Education Specialists | $81,726 |
| Community Health Workers | $73,901 |
References
- IPEDS — Integrated Postsecondary Education Data System
- U.S. Department of Education — College Scorecard
- O*NET Online (Bureau of Labor Statistics)
- National Center for Education Statistics
More about our data sources and methodologies.
HealthcareDegreeSearch.com provides higher-education, college and university, degree, program, career, salary, and other helpful information to students, faculty, institutions, and other internet audiences. Presented information and data are subject to change. Inclusion on this website does not imply or represent a direct relationship with the company, school, or brand. Information, though believed correct at time of publication, may not be correct, and no warranty is provided. Contact the schools to verify any information before relying on it. Financial aid may be available for those who qualify. The displayed options may include sponsored or recommended results, not necessarily based on your preferences.
© HealthcareDegreeSearch.com – All Rights Reserved.