Other Mental Health Services at Marian University
What traits are you looking for in a school for Other Mental Health Services, take a look at what Marian University. We’ve gathered the following information to help you decide.
Marian University is in Fond Du Lac, WI.
During the most recent reporting year, 44 other mental health services degrees were granted at Marian University.
Featured schools near , edit
Studying Online at Marian University
Many students take online classes at Marian University. Among 1,246 students, 372 (30%) studied exclusively online and 182 (15%) took at least some classes online.
Other Mental Health Services Rankings at Marian University
These rankings give you a sense of how Marian University’s Other Mental Health Services program to other colleges that offer this major.
Master’s-Level Rankings
| Ranking | Scope | Rank |
|---|---|---|
| Best Schools (Quality) | Great Lakes (Region) | #1 of 2 |
| Best Schools (Quality) | Wisconsin | #1 of 1 |
| Best Value | Wisconsin | #2 of 2 |
| Best Value | Great Lakes (Region) | #12 of 12 |
| Best Schools (Quality) | Nationwide | #25 of 55 |
| Best Value | Nationwide | #83 of 92 |
Student Demographics & Diversity
Take a look at the student demographics for Other Mental Health Services graduates at Marian University, by degree type.
Looking at the program as a whole, Other Mental Health Services graduates at Marian University are 91% women (40) and 9% men (4).
Other Mental Health Services Master’s Program at Marian University
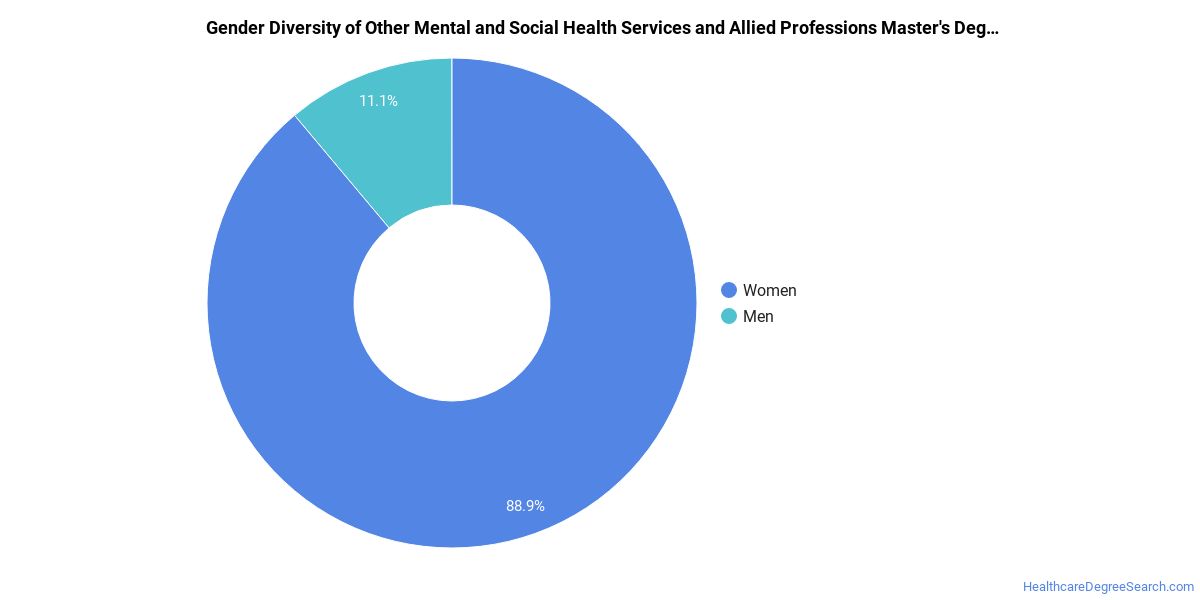
Among the 39 master’s other mental health services degrees awarded at Marian University, 92% were women (36) and 8% were men (3).
The following table and chart show the race/ethnicity of Other Mental Health Services master’s degree recipients at Marian University.
| Race / Ethnicity | Number of Graduates |
|---|---|
| White | 32 |
| Hispanic / Latino | 5 |
| Black / African American | 1 |
| Unknown | 1 |
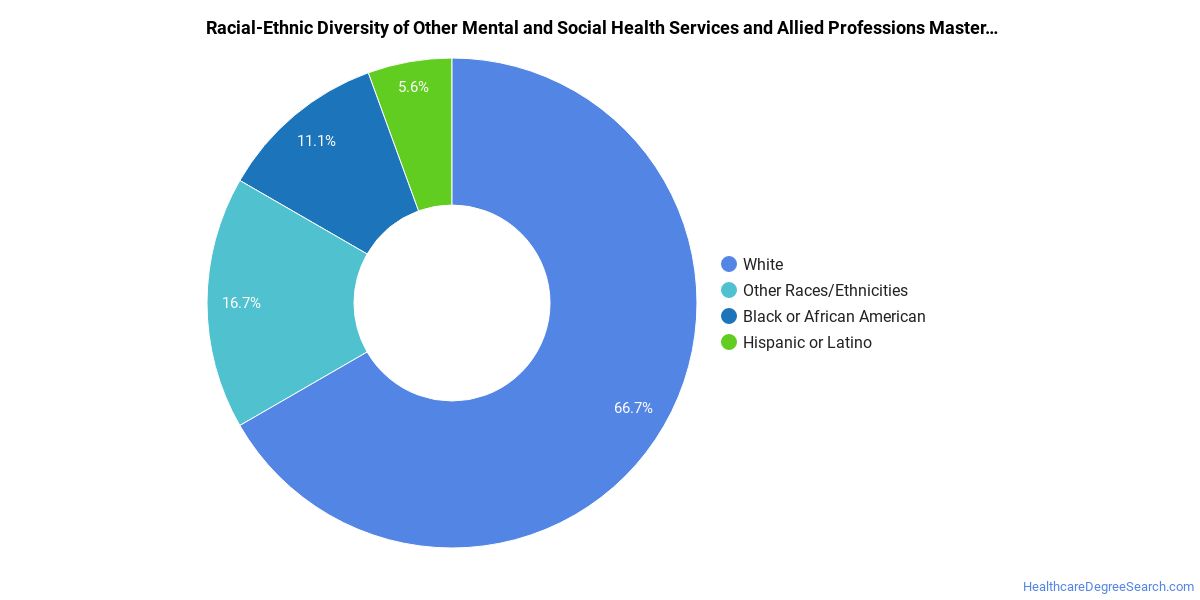
Minority students account for 15% of Other Mental Health Services master’s degree recipients at Marian University, below the national average of 42%.*
*The racial-ethnic minorities figure is the total number of graduates minus White, international (nonresident), and unknown-race graduates.
References
- IPEDS — Integrated Postsecondary Education Data System
- U.S. Department of Education — College Scorecard
- O*NET Online (Bureau of Labor Statistics)
- National Center for Education Statistics
More about our data sources and methodologies.
HealthcareDegreeSearch.com provides higher-education, college and university, degree, program, career, salary, and other helpful information to students, faculty, institutions, and other internet audiences. Presented information and data are subject to change. Inclusion on this website does not imply or represent a direct relationship with the company, school, or brand. Information, though believed correct at time of publication, may not be correct, and no warranty is provided. Contact the schools to verify any information before relying on it. Financial aid may be available for those who qualify. The displayed options may include sponsored or recommended results, not necessarily based on your preferences.
© HealthcareDegreeSearch.com – All Rights Reserved.