Health Sciences & Services at Mercy College of Ohio
What traits are you looking for in a school for Health Sciences & Services, consider the program at Mercy College of Ohio. Get started with the following essential facts.
Mercy College of Ohio is located in Toledo, OH.
In the most recent year for which we have data, 35 health sciences & services graduations were recorded at Mercy College of Ohio.
Featured schools near , edit
Studying Online at Mercy College of Ohio
Distance learning is available at Mercy College of Ohio. Among 1,096 students, 456 (42%) were enrolled entirely in distance education and 369 (34%) took at least some classes online.
Health Sciences & Services Rankings at Mercy College of Ohio
Rankings can help you compare Mercy College of Ohio’s Health Sciences & Services program to other colleges that offer this major.
Bachelor’s-Level Rankings
| Ranking | Scope | Rank |
|---|---|---|
| Best Value | Ohio | #1 of 9 |
| Best Schools (Quality) | Ohio | #6 of 8 |
| Best Value | Great Lakes (Region) | #15 of 39 |
| Best Schools (Quality) | Great Lakes (Region) | #27 of 41 |
| Best Value | Nationwide | #277 of 471 |
| Best Schools (Quality) | Nationwide | #323 of 478 |
Associate-Level Rankings
| Ranking | Scope | Rank |
|---|---|---|
| Best Value | Ohio | #1 of 9 |
| Best Schools (Quality) | Ohio | #6 of 8 |
| Best Value | Great Lakes (Region) | #15 of 39 |
| Best Schools (Quality) | Great Lakes (Region) | #27 of 41 |
| Best Value | Nationwide | #277 of 471 |
| Best Schools (Quality) | Nationwide | #323 of 478 |
Earnings for Health Sciences & Services Graduates from Mercy College of Ohio
Students who complete Mercy College of Ohio’s Health Sciences & Services program earn at the following median levels (per the U.S. Department of Education’s College Scorecard):
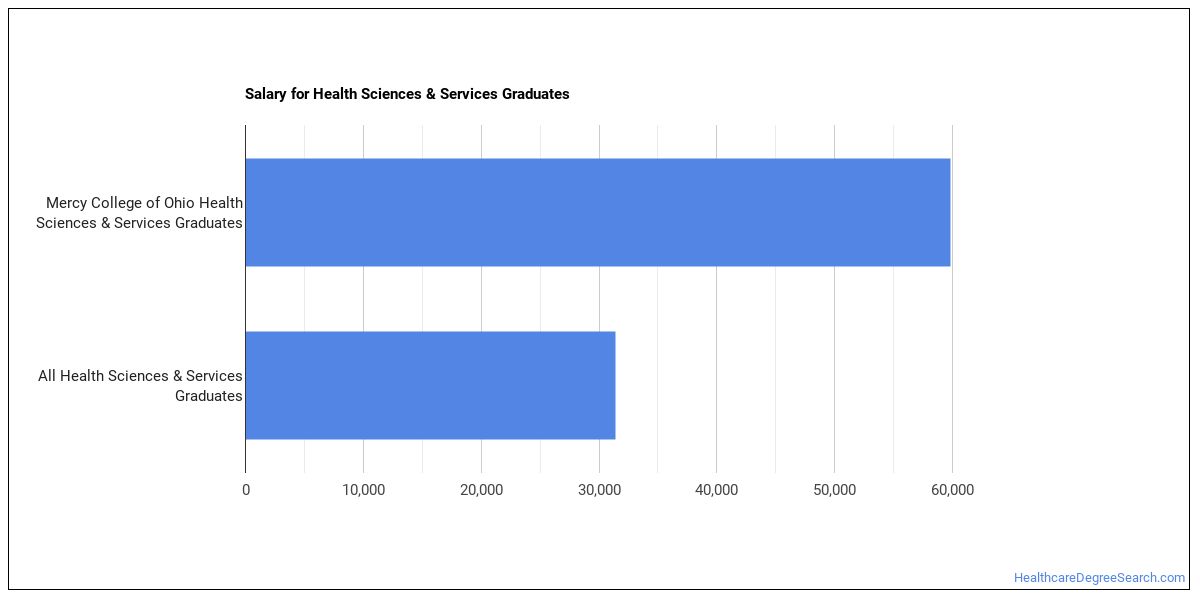
| Years After Graduation | Median Earnings |
|---|---|
| 1 year | $59,808 |
| 2 years | $50,439 |
| 3 years | $51,952 |
| 5 years | $62,557 |
Median Debt at Graduation
Typical debt at graduation for Health Sciences & Services graduates from Mercy College of Ohio stands at $37,025.
Student Demographics & Diversity
Take a look at the diversity of Health Sciences & Services graduates at Mercy College of Ohio, by degree type.
Looking at the program as a whole, Health Sciences & Services graduates at Mercy College of Ohio are 86% women (30) and 14% men (5).
Health Sciences & Services Associate’s Program at Mercy College of Ohio
Among the 1 associate’s health sciences & services degrees awarded at Mercy College of Ohio, 100% were women (1) and 0% were men (0).

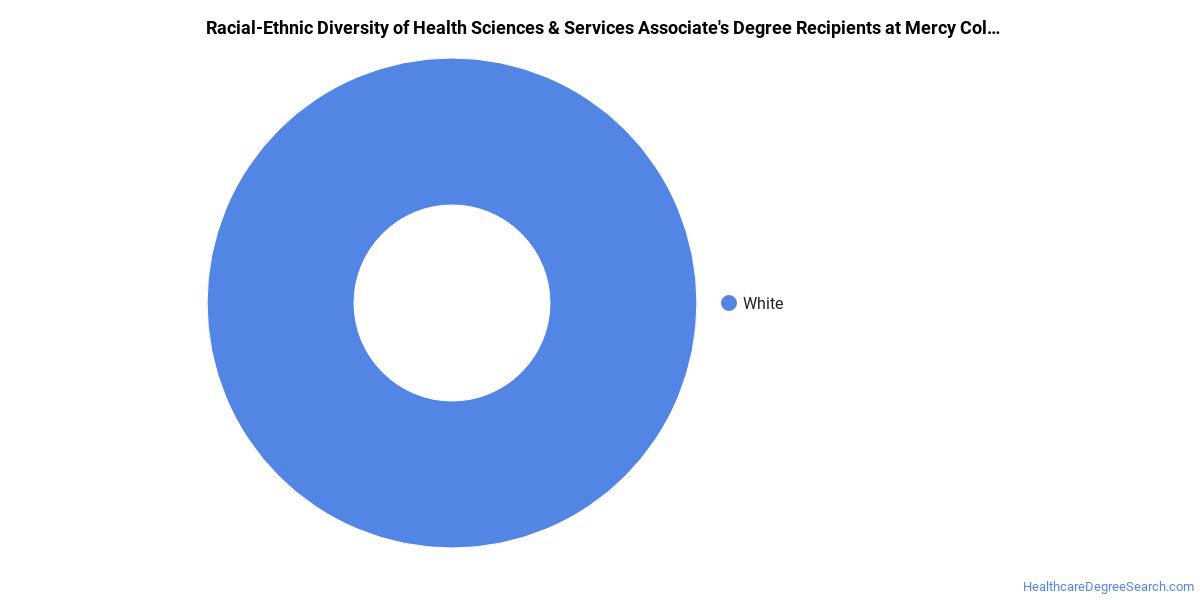
The following table and chart show the race/ethnicity of Health Sciences & Services associate’s degree recipients at Mercy College of Ohio.
| Race / Ethnicity | Number of Graduates |
|---|---|
| White | 1 |
Health Sciences & Services Bachelor’s Program at Mercy College of Ohio
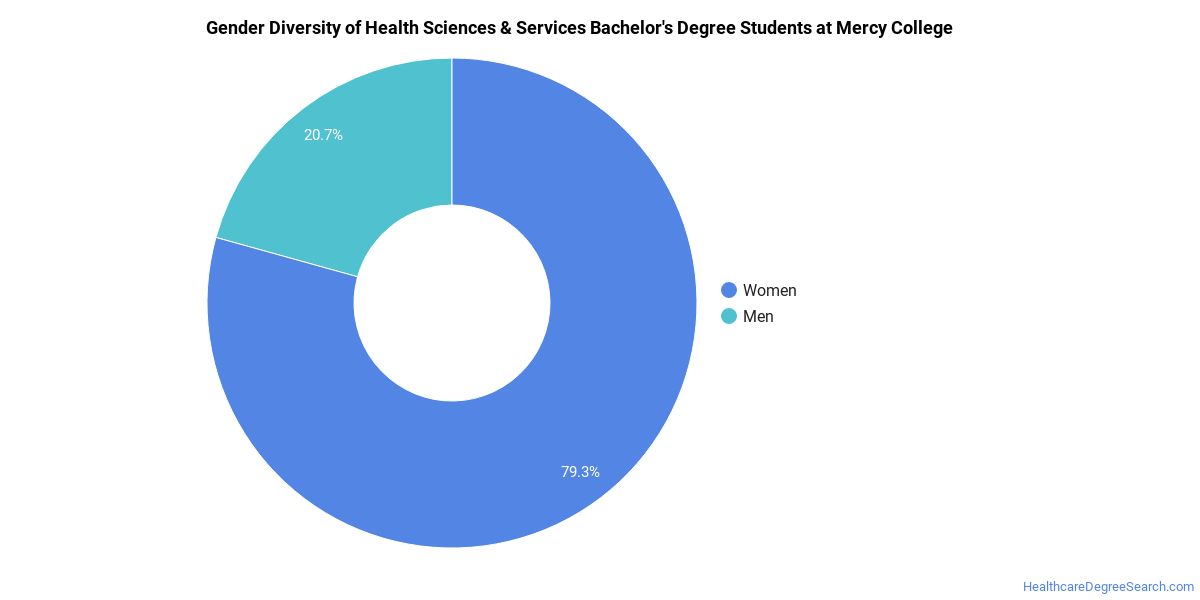
Of the 34 bachelor’s health sciences & services graduates at Mercy College of Ohio, 85% were women (29) and 15% were men (5).
The following table and chart show the race/ethnicity of Health Sciences & Services bachelor’s degree recipients at Mercy College of Ohio.
| Race / Ethnicity | Number of Graduates |
|---|---|
| White | 26 |
| Hispanic / Latino | 3 |
| Black / African American | 1 |
| Asian | 3 |
| American Indian / Alaska Native | 1 |
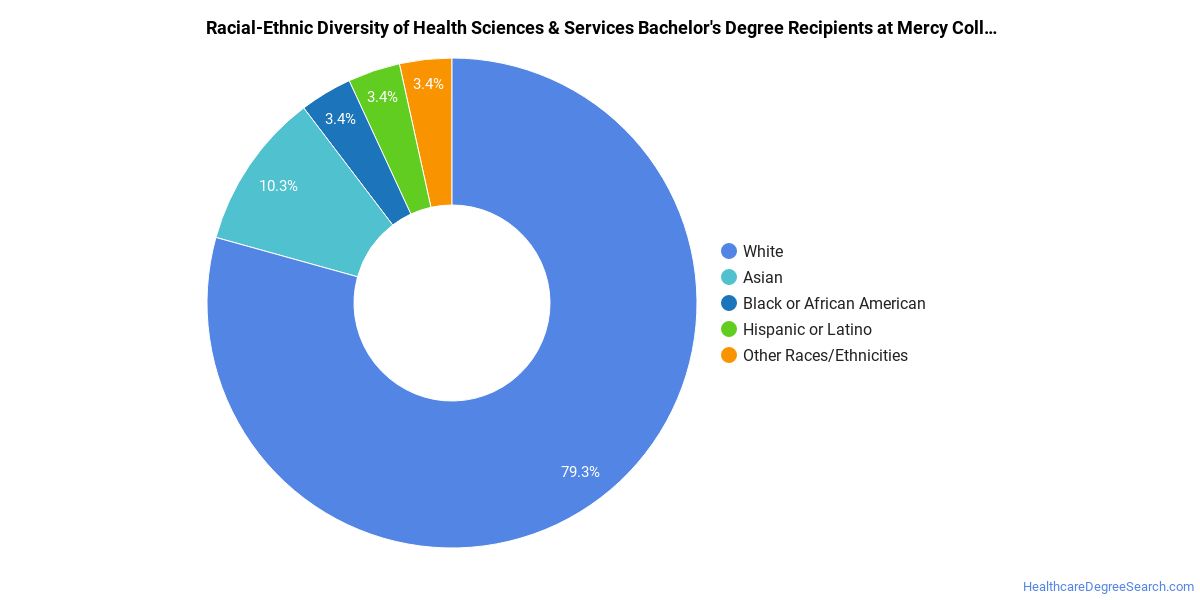
Racial-ethnic minorities make up 24% of Health Sciences & Services bachelor’s degree recipients at Mercy College of Ohio, lower than the national average of 50%.*
*The racial-ethnic minorities figure is the total number of graduates minus White, international (nonresident), and unknown-race graduates.
More Specific Health Sciences & Services Concentrations at Mercy College of Ohio
The Health Sciences & Services program at Mercy College of Ohio breaks down into more specific concentrations:
| Concentration | Graduates |
|---|---|
| General/Allied Health Sciences | 35 |
Best-Paid Careers for Health Sciences & Services Graduates
Students who finish Health Sciences & Services program at Mercy College of Ohio work across a variety of fields. The table below ranks the highest-paying careers for Health Sciences & Services graduates, ordered by median annual salary:
| Occupation | Nationwide Median Wage |
|---|---|
| Health Education Specialists | $81,726 |
| Community Health Workers | $73,901 |
References
- IPEDS — Integrated Postsecondary Education Data System
- U.S. Department of Education — College Scorecard
- O*NET Online (Bureau of Labor Statistics)
- National Center for Education Statistics
More about our data sources and methodologies.
HealthcareDegreeSearch.com provides higher-education, college and university, degree, program, career, salary, and other helpful information to students, faculty, institutions, and other internet audiences. Presented information and data are subject to change. Inclusion on this website does not imply or represent a direct relationship with the company, school, or brand. Information, though believed correct at time of publication, may not be correct, and no warranty is provided. Contact the schools to verify any information before relying on it. Financial aid may be available for those who qualify. The displayed options may include sponsored or recommended results, not necessarily based on your preferences.
© HealthcareDegreeSearch.com – All Rights Reserved.