Other Health & Clinical Sciences at Ohio State University-Main Campus
What traits are you looking for in a school for Other Health & Clinical Sciences, you may want to check out the program at Ohio State University-Main Campus. We’ve gathered the following information to help you decide.
Ohio State University-Main Campus sits in Columbus, OH.
For the most recent IPEDS reporting year, 9 other health & clinical sciences degrees were awarded at Ohio State University-Main Campus.
Featured schools near , edit
Online Class Availability at Ohio State University-Main Campus
Many students take online classes at Ohio State University-Main Campus. Of 61,443 students, 3,975 (6%) studied exclusively online and 34,956 (57%) took at least some classes online.
Other Health & Clinical Sciences Rankings at Ohio State University-Main Campus
These rankings give you a sense of how Ohio State University-Main Campus’s Other Health & Clinical Sciences program against peer institutions.
Master’s-Level Rankings
| Ranking | Scope | Rank |
|---|---|---|
| Best Schools (Quality) | Great Lakes (Region) | #None of 23 |
| Best Schools (Quality) | Ohio | #None of 8 |
| Best Schools (Quality) | Nationwide | #None of 111 |
| Best Value | Great Lakes (Region) | #None of 24 |
| Best Value | Ohio | #None of 9 |
| Best Value | Nationwide | #None of 109 |
Doctoral-Level Rankings
| Ranking | Scope | Rank |
|---|---|---|
| Best Schools (Quality) | Great Lakes (Region) | #None of 23 |
| Best Schools (Quality) | Ohio | #None of 8 |
| Best Schools (Quality) | Nationwide | #None of 111 |
| Best Value | Great Lakes (Region) | #None of 24 |
| Best Value | Ohio | #None of 9 |
| Best Value | Nationwide | #None of 109 |
Student Demographics & Diversity
The following sections describe the composition of Other Health & Clinical Sciences graduates at Ohio State University-Main Campus, by degree type.
Program-wide, Other Health & Clinical Sciences graduates at Ohio State University-Main Campus are 44% women (4) and 56% men (5).
Other Health & Clinical Sciences Master’s Program at Ohio State University-Main Campus
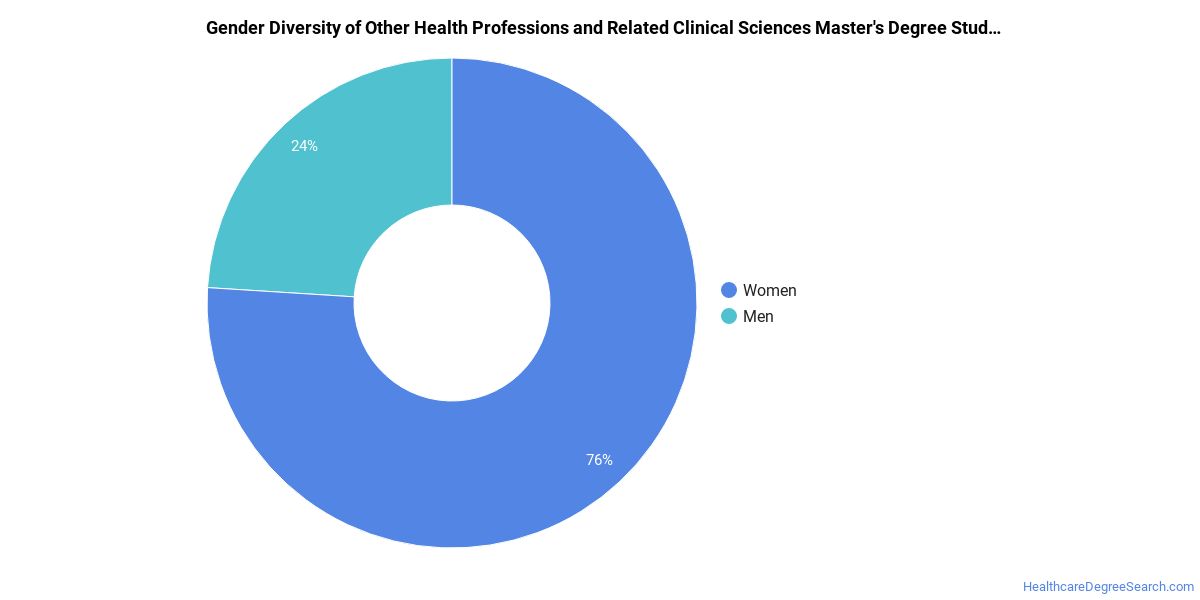
Among the 3 master’s other health & clinical sciences degrees awarded at Ohio State University-Main Campus, 67% were women (2) and 33% were men (1).
The following table and chart show the race/ethnicity of Other Health & Clinical Sciences master’s degree recipients at Ohio State University-Main Campus.
| Race / Ethnicity | Number of Graduates |
|---|---|
| White | 2 |
| Black / African American | 1 |
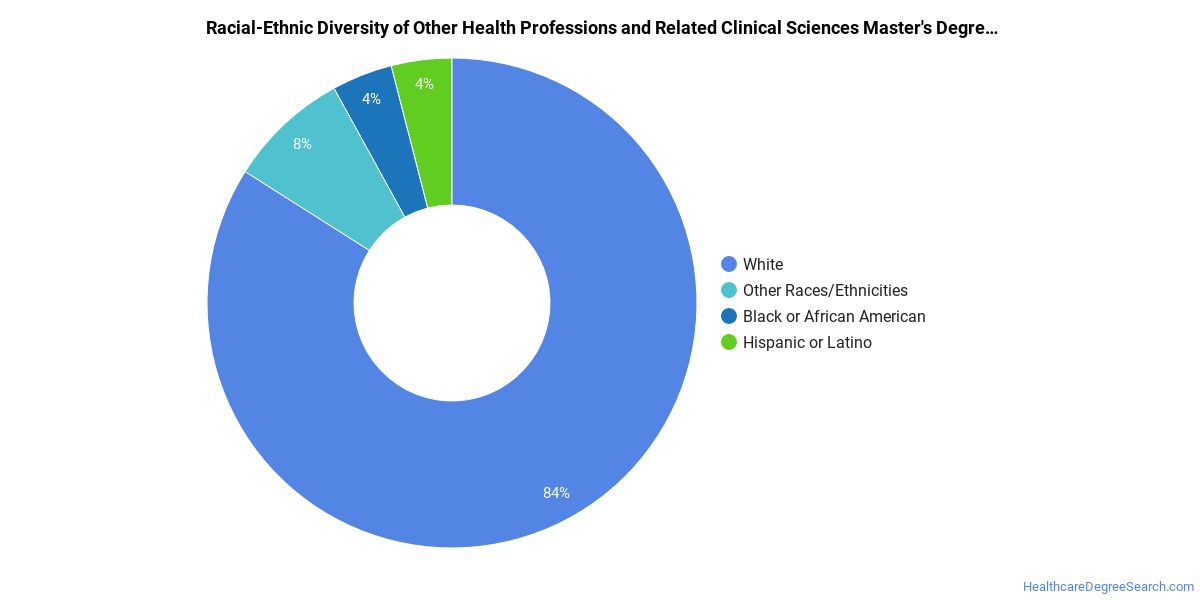
Racial-ethnic minorities make up 33% of Other Health & Clinical Sciences master’s degree recipients at Ohio State University-Main Campus, lower than the national average of 35%.*
Other Health & Clinical Sciences Doctoral Program at Ohio State University-Main Campus
Of the 6 doctoral other health & clinical sciences graduates at Ohio State University-Main Campus, 33% were women (2) and 67% were men (4).

The following table and chart show the race/ethnicity of Other Health & Clinical Sciences doctoral degree recipients at Ohio State University-Main Campus.
| Race / Ethnicity | Number of Graduates |
|---|---|
| White | 5 |
| Two or More Races | 1 |

Minority students account for 17% of Other Health & Clinical Sciences doctoral degree recipients at Ohio State University-Main Campus, below the national average of 27%.*
*The racial-ethnic minorities figure is the total number of graduates minus White, international (nonresident), and unknown-race graduates.
References
- IPEDS — Integrated Postsecondary Education Data System
- U.S. Department of Education — College Scorecard
- O*NET Online (Bureau of Labor Statistics)
- National Center for Education Statistics
More about our data sources and methodologies.
HealthcareDegreeSearch.com provides higher-education, college and university, degree, program, career, salary, and other helpful information to students, faculty, institutions, and other internet audiences. Presented information and data are subject to change. Inclusion on this website does not imply or represent a direct relationship with the company, school, or brand. Information, though believed correct at time of publication, may not be correct, and no warranty is provided. Contact the schools to verify any information before relying on it. Financial aid may be available for those who qualify. The displayed options may include sponsored or recommended results, not necessarily based on your preferences.
© HealthcareDegreeSearch.com – All Rights Reserved.