Health Sciences & Services at Saint Peter’s University
If you plan to study Health Sciences & Services, you may want to check out the program at Saint Peter’s University. Get started with the following essential facts.
Saint Peter’s University is located in Jersey City, NJ.
For the most recent IPEDS reporting year, 23 health sciences & services degrees were granted at Saint Peter’s University.
Featured schools near , edit
Studying Online at Saint Peter’s University
Many students take online classes at Saint Peter’s University. Among 3,572 students, 742 (21%) were enrolled entirely in distance education and 1,642 (46%) took at least some classes online.
Student Demographics & Diversity
Take a look at the student demographics for Health Sciences & Services graduates at Saint Peter’s University, by degree type.
Program-wide, Health Sciences & Services graduates at Saint Peter’s University are 78% women (18) and 22% men (5).
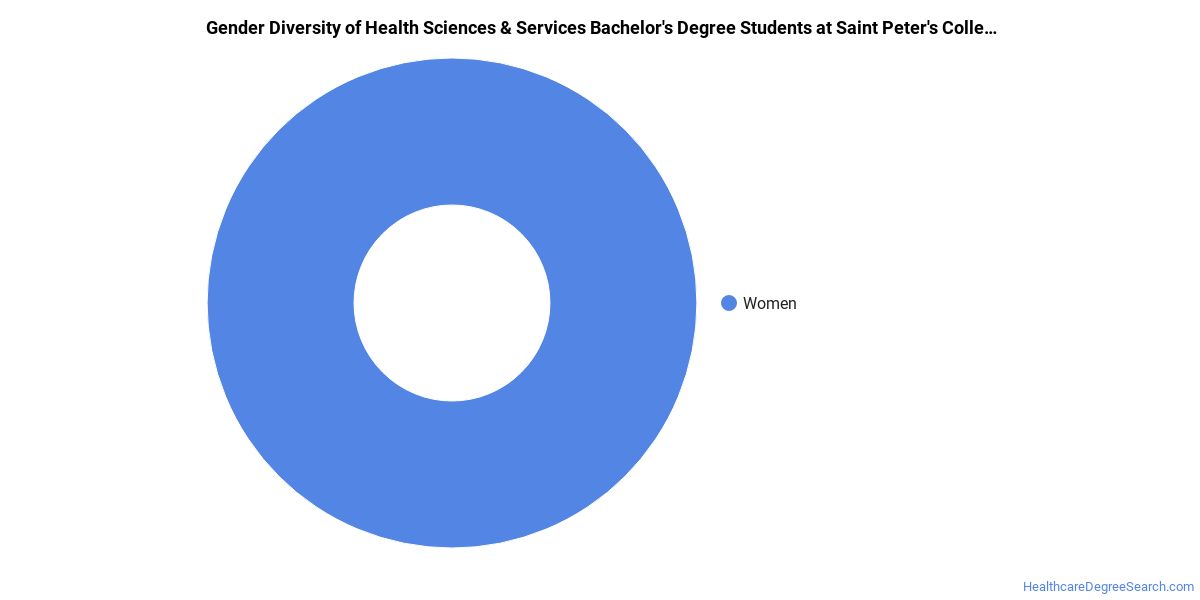
Health Sciences & Services Bachelor’s Program at Saint Peter’s University
Among the 15 bachelor’s health sciences & services graduates at Saint Peter’s University, 73% were women (11) and 27% were men (4).
The following table and chart show the race/ethnicity of Health Sciences & Services bachelor’s degree recipients at Saint Peter’s University.
| Race / Ethnicity | Number of Graduates |
|---|---|
| Hispanic / Latino | 8 |
| Black / African American | 4 |
| Asian | 3 |

Racial-ethnic minorities make up 100% of Health Sciences & Services bachelor’s degree recipients at Saint Peter’s University, higher than the national average of 50%.*
Health Sciences & Services Master’s Program at Saint Peter’s University
Among the 8 master’s health sciences & services degrees awarded at Saint Peter’s University, 88% were women (7) and 12% were men (1).

The following table and chart show the race/ethnicity of Health Sciences & Services master’s degree recipients at Saint Peter’s University.
| Race / Ethnicity | Number of Graduates |
|---|---|
| White | 4 |
| Hispanic / Latino | 4 |

Minority students account for 50% of Health Sciences & Services master’s degree recipients at Saint Peter’s University, lower than the national average of 57%.*
*The racial-ethnic minorities figure is the total number of graduates minus White, international (nonresident), and unknown-race graduates.
More Specific Health Sciences & Services Concentrations at Saint Peter’s University
This Health Sciences & Services program at Saint Peter’s University includes the following sub-specializations:
| Concentration | Graduates |
|---|---|
| General/Allied Health Sciences | 23 |
Top-Paying Careers for Health Sciences & Services Graduates
Those who complete Health Sciences & Services program at Saint Peter’s University go on to a range of careers. The table below ranks the best-paid careers for Health Sciences & Services majors, ordered by median annual salary:
| Occupation | Nationwide Median Wage |
|---|---|
| Health Education Specialists | $81,726 |
| Community Health Workers | $73,901 |
References
- IPEDS — Integrated Postsecondary Education Data System
- U.S. Department of Education — College Scorecard
- O*NET Online (Bureau of Labor Statistics)
- National Center for Education Statistics
More about our data sources and methodologies.
HealthcareDegreeSearch.com provides higher-education, college and university, degree, program, career, salary, and other helpful information to students, faculty, institutions, and other internet audiences. Presented information and data are subject to change. Inclusion on this website does not imply or represent a direct relationship with the company, school, or brand. Information, though believed correct at time of publication, may not be correct, and no warranty is provided. Contact the schools to verify any information before relying on it. Financial aid may be available for those who qualify. The displayed options may include sponsored or recommended results, not necessarily based on your preferences.
© HealthcareDegreeSearch.com – All Rights Reserved.