Occupational Therapy at Springfield College
If you plan to study Occupational Therapy, consider the program at Springfield College. Get started with the following essential facts.
Springfield College sits in Springfield, MA.
In the most recent year for which we have data, 60 occupational therapy degrees were awarded at Springfield College.
Featured schools near , edit
Studying Online at Springfield College
Distance learning is available at Springfield College. Among 2,599 students, 14 (1%) were enrolled entirely in distance education and 223 (9%) took at least some classes online.
Occupational Therapy Rankings at Springfield College
These rankings give you a sense of how Springfield College’s Occupational Therapy program against peer institutions.
Bachelor’s-Level Rankings
| Ranking | Scope | Rank |
|---|---|---|
| Best Schools (Quality) | Massachusetts | #7 of 11 |
| Best Value | Massachusetts | #7 of 10 |
| Best Value | New England (Region) | #11 of 20 |
| Best Schools (Quality) | New England (Region) | #12 of 19 |
| Best Schools (Quality) | Nationwide | #132 of 217 |
| Best Value | Nationwide | #171 of 210 |
Master’s-Level Rankings
| Ranking | Scope | Rank |
|---|---|---|
| Best Schools (Quality) | Massachusetts | #7 of 11 |
| Best Value | Massachusetts | #7 of 10 |
| Best Value | New England (Region) | #11 of 20 |
| Best Schools (Quality) | New England (Region) | #12 of 19 |
| Best Schools (Quality) | Nationwide | #132 of 217 |
| Best Value | Nationwide | #171 of 210 |
Student Demographics & Diversity
Take a look at the diversity of Occupational Therapy graduates at Springfield College, broken down by degree level.
Program-wide, Occupational Therapy graduates at Springfield College are 87% women (52) and 13% men (8).
Occupational Therapy Bachelor’s Program at Springfield College
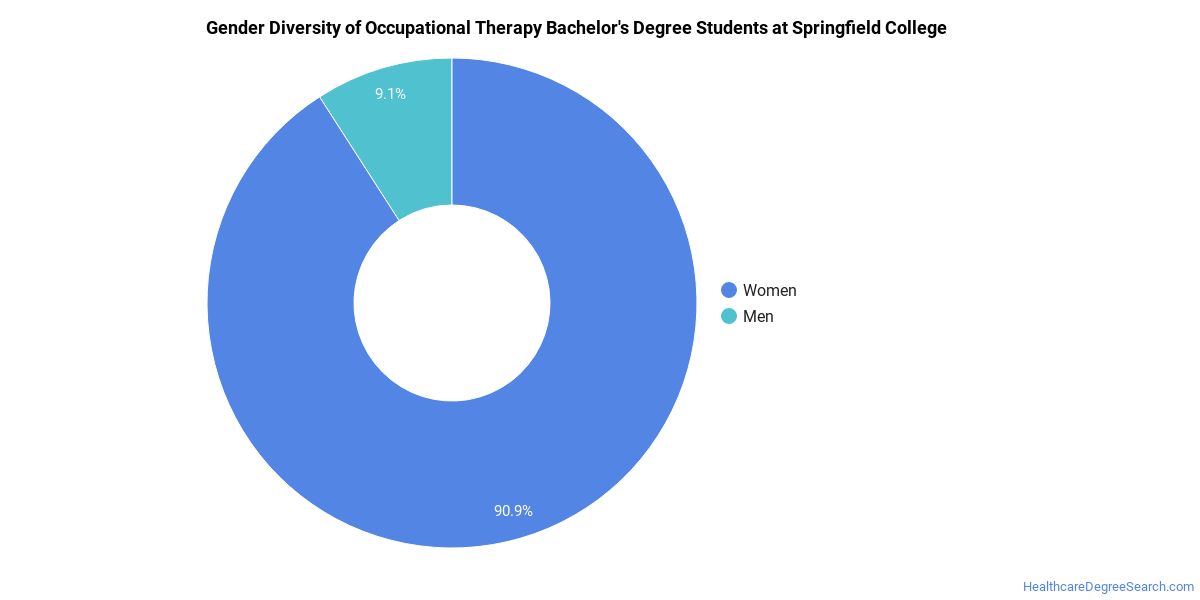
Of the 25 bachelor’s occupational therapy graduates at Springfield College, 88% were women (22) and 12% were men (3).
The following table and chart show the race/ethnicity of Occupational Therapy bachelor’s degree recipients at Springfield College.
| Race / Ethnicity | Number of Graduates |
|---|---|
| White | 19 |
| Hispanic / Latino | 1 |
| Black / African American | 1 |
| Unknown | 4 |
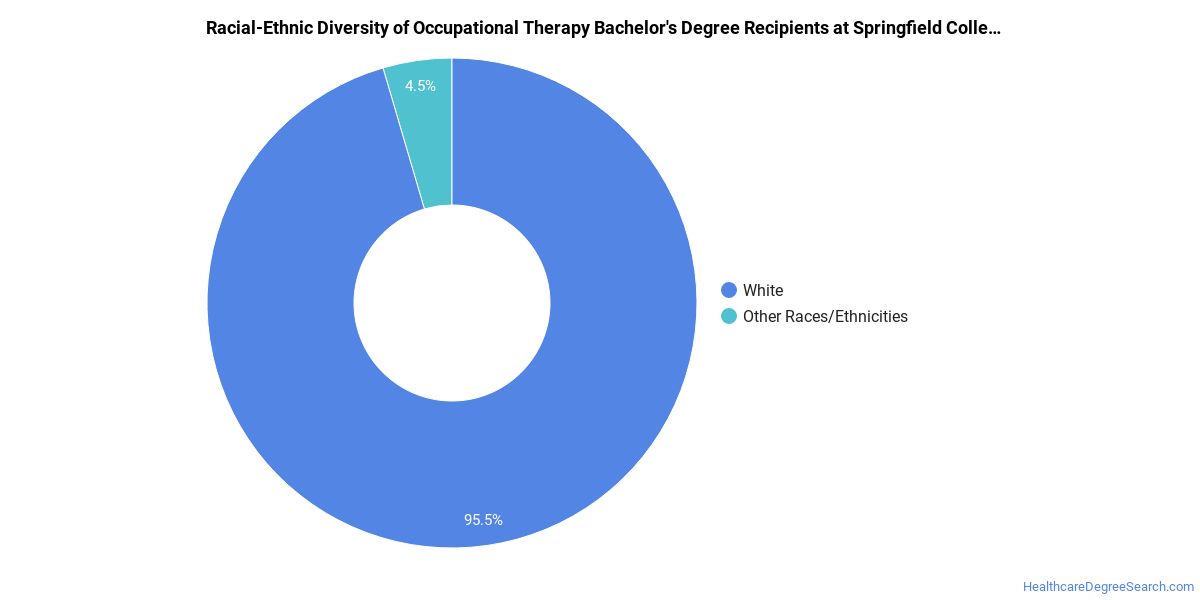
Minority students account for 8% of Occupational Therapy bachelor’s degree recipients at Springfield College, lower than the national average of 14%.*
Occupational Therapy Master’s Program at Springfield College
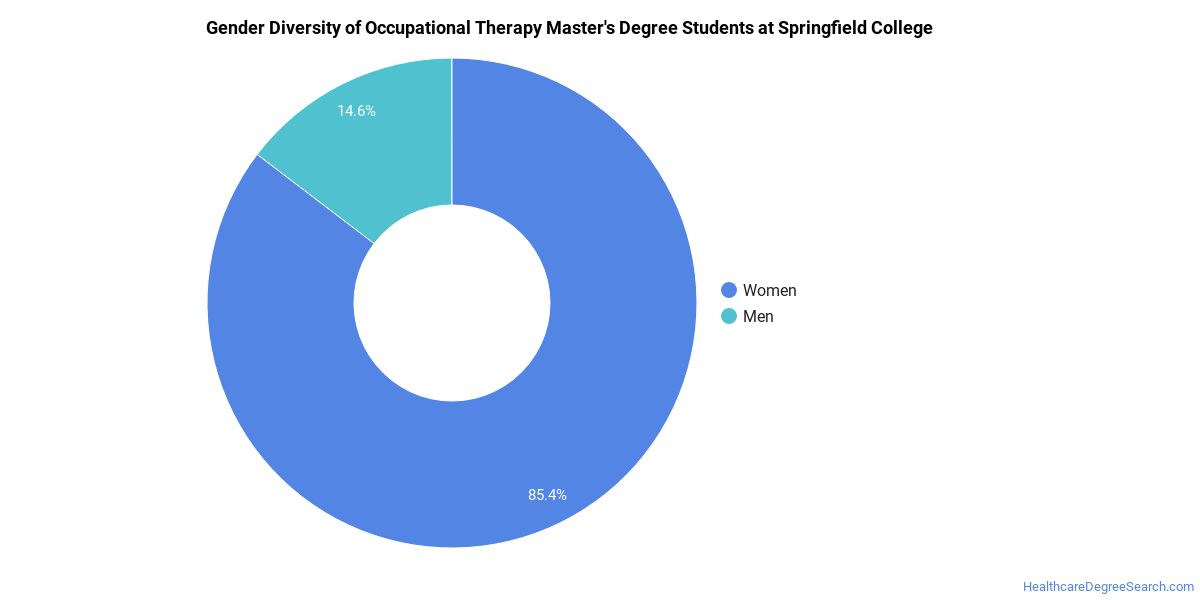
Of the 35 master’s occupational therapy degrees awarded at Springfield College, 86% were women (30) and 14% were men (5).
The following table and chart show the race/ethnicity of Occupational Therapy master’s degree recipients at Springfield College.
| Race / Ethnicity | Number of Graduates |
|---|---|
| White | 23 |
| Hispanic / Latino | 1 |
| Black / African American | 1 |
| International (Nonresident) | 2 |
| Unknown | 8 |
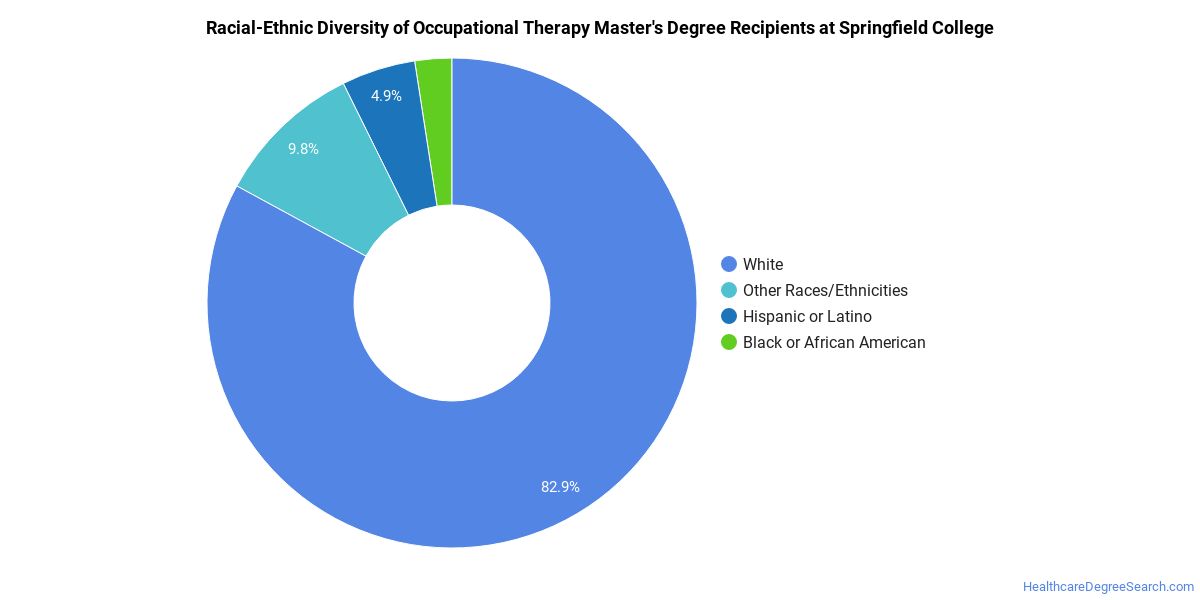
Minority students account for 6% of Occupational Therapy master’s degree recipients at Springfield College, below the national average of 27%.*
*The racial-ethnic minorities figure is the total number of graduates minus White, international (nonresident), and unknown-race graduates.
Top-Paying Careers for Occupational Therapy Graduates
Those who complete Occupational Therapy program at Springfield College pursue many career paths. Here are the top-paying careers for Occupational Therapy graduates, ordered by median annual salary:
| Occupation | Nationwide Median Wage |
|---|---|
| Low Vision Therapists, Orientation and Mobility Specialists, and Vision Rehabilitation Therapists | $124,839 |
| Occupational Therapists | $82,501 |
| Health Specialties Teachers, Postsecondary | $46,663 |
References
- IPEDS — Integrated Postsecondary Education Data System
- U.S. Department of Education — College Scorecard
- O*NET Online (Bureau of Labor Statistics)
- National Center for Education Statistics
More about our data sources and methodologies.
HealthcareDegreeSearch.com provides higher-education, college and university, degree, program, career, salary, and other helpful information to students, faculty, institutions, and other internet audiences. Presented information and data are subject to change. Inclusion on this website does not imply or represent a direct relationship with the company, school, or brand. Information, though believed correct at time of publication, may not be correct, and no warranty is provided. Contact the schools to verify any information before relying on it. Financial aid may be available for those who qualify. The displayed options may include sponsored or recommended results, not necessarily based on your preferences.
© HealthcareDegreeSearch.com – All Rights Reserved.