Health Sciences & Services at The University of Texas Rio Grande Valley
If you plan to study Health Sciences & Services, consider the program at The University of Texas Rio Grande Valley. The following information will help you decide if it is a good fit for you.
The University of Texas Rio Grande Valley is located in Edinburg, TX.
In the most recent year for which we have data, 351 health sciences & services degrees were awarded at The University of Texas Rio Grande Valley.
Featured schools near , edit
Online Class Availability at The University of Texas Rio Grande Valley
Online coursework is an option at The University of Texas Rio Grande Valley. Among 33,881 students, 5,219 (15%) were enrolled entirely in distance education and 17,255 (51%) took at least some classes online.
Health Sciences & Services Rankings at The University of Texas Rio Grande Valley
Rankings can help you compare The University of Texas Rio Grande Valley’s Health Sciences & Services program to other colleges that offer this major.
Bachelor’s-Level Rankings
| Ranking | Scope | Rank |
|---|---|---|
| Best Value | Texas | #5 of 37 |
| Best Value | Southwest (Region) | #8 of 52 |
| Best Schools (Quality) | Texas | #12 of 38 |
| Best Schools (Quality) | Southwest (Region) | #17 of 54 |
| Best Value | Nationwide | #76 of 471 |
| Best Schools (Quality) | Nationwide | #205 of 478 |
Master’s-Level Rankings
| Ranking | Scope | Rank |
|---|---|---|
| Best Value | Texas | #5 of 37 |
| Best Value | Southwest (Region) | #8 of 52 |
| Best Schools (Quality) | Texas | #12 of 38 |
| Best Schools (Quality) | Southwest (Region) | #17 of 54 |
| Best Value | Nationwide | #76 of 471 |
| Best Schools (Quality) | Nationwide | #205 of 478 |
Earnings for Health Sciences & Services Graduates from The University of Texas Rio Grande Valley
Those who finish The University of Texas Rio Grande Valley’s Health Sciences & Services program earn at the following median levels (per the U.S. Department of Education’s College Scorecard):

| Years After Graduation | Median Earnings |
|---|---|
| 1 year | $44,674 |
| 2 years | $36,674 |
| 4 years | $50,310 |
| 5 years | $61,088 |
Is this above or below average for the school? Four years after graduating, Health Sciences & Services graduates from The University of Texas Rio Grande Valley take home a median $50,310, compared with $53,002 for all The University of Texas Rio Grande Valley graduates — about 5% lower than the school-wide median.

Median Debt at Graduation
Typical debt at graduation for Health Sciences & Services graduates from The University of Texas Rio Grande Valley stands at $16,500.
Student Demographics & Diversity
Take a look at the student demographics for Health Sciences & Services graduates at The University of Texas Rio Grande Valley, broken down by degree level.
Program-wide, Health Sciences & Services graduates at The University of Texas Rio Grande Valley are 79% women (279) and 21% men (72).
Health Sciences & Services Bachelor’s Program at The University of Texas Rio Grande Valley
Of the 206 bachelor’s health sciences & services degrees awarded at The University of Texas Rio Grande Valley, 84% were women (173) and 16% were men (33).

The following table and chart show the race/ethnicity of Health Sciences & Services bachelor’s degree recipients at The University of Texas Rio Grande Valley.
| Race / Ethnicity | Number of Graduates |
|---|---|
| White | 2 |
| Hispanic / Latino | 196 |
| Black / African American | 2 |
| Asian | 3 |
| International (Nonresident) | 1 |
| Unknown | 2 |

Racial-ethnic minorities make up 98% of Health Sciences & Services bachelor’s degree recipients at The University of Texas Rio Grande Valley, above the national average of 50%.*
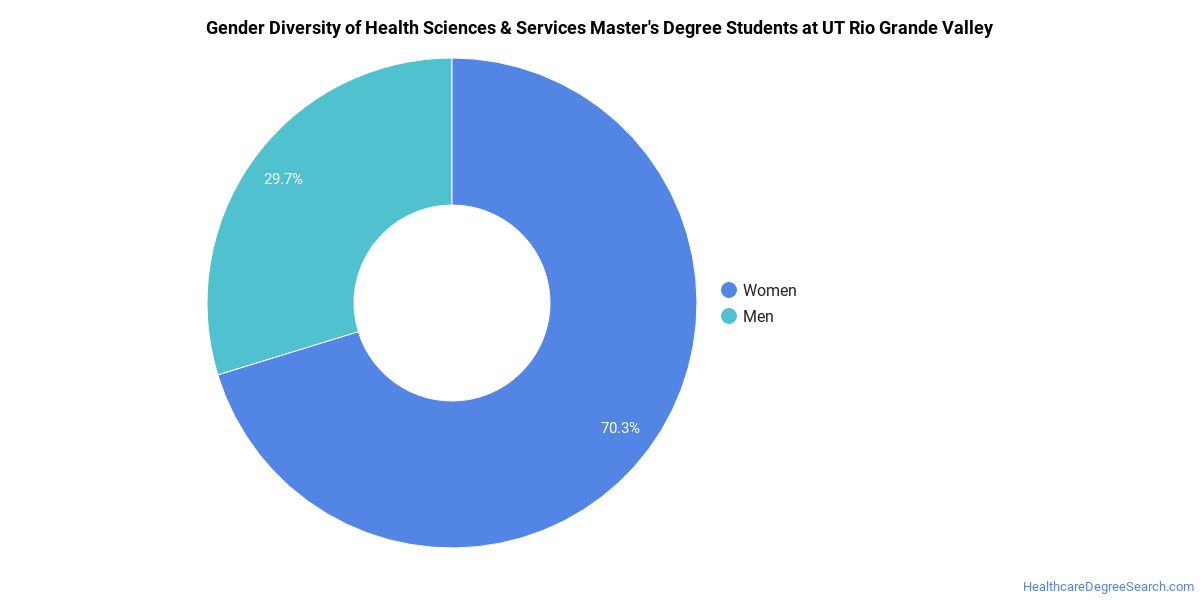
Health Sciences & Services Master’s Program at The University of Texas Rio Grande Valley
Of the 144 master’s health sciences & services graduates at The University of Texas Rio Grande Valley, 74% were women (106) and 26% were men (38).
The following table and chart show the race/ethnicity of Health Sciences & Services master’s degree recipients at The University of Texas Rio Grande Valley.
| Race / Ethnicity | Number of Graduates |
|---|---|
| White | 15 |
| Hispanic / Latino | 89 |
| Black / African American | 17 |
| Asian | 9 |
| American Indian / Alaska Native | 1 |
| Native Hawaiian / Pacific Islander | 1 |
| International (Nonresident) | 11 |
| Unknown | 1 |

Racial-ethnic minorities make up 81% of Health Sciences & Services master’s degree recipients at The University of Texas Rio Grande Valley, above the national average of 57%.*
*The racial-ethnic minorities figure is the total number of graduates minus White, international (nonresident), and unknown-race graduates.
More Specific Health Sciences & Services Concentrations at The University of Texas Rio Grande Valley
The Health Sciences & Services program at The University of Texas Rio Grande Valley breaks down into more specific concentrations:
| Concentration | Graduates |
|---|---|
| General/Allied Health Sciences | 326 |
| General Health & Wellness | 25 |
Top-Paying Careers for Health Sciences & Services Graduates
Students who finish Health Sciences & Services program at The University of Texas Rio Grande Valley go on to a range of careers. The table below ranks the best-paid careers for Health Sciences & Services graduates, ordered by median annual salary:
| Occupation | Nationwide Median Wage |
|---|---|
| Health Education Specialists | $81,726 |
| Community Health Workers | $73,901 |
References
- IPEDS — Integrated Postsecondary Education Data System
- U.S. Department of Education — College Scorecard
- O*NET Online (Bureau of Labor Statistics)
- National Center for Education Statistics
More about our data sources and methodologies.
HealthcareDegreeSearch.com provides higher-education, college and university, degree, program, career, salary, and other helpful information to students, faculty, institutions, and other internet audiences. Presented information and data are subject to change. Inclusion on this website does not imply or represent a direct relationship with the company, school, or brand. Information, though believed correct at time of publication, may not be correct, and no warranty is provided. Contact the schools to verify any information before relying on it. Financial aid may be available for those who qualify. The displayed options may include sponsored or recommended results, not necessarily based on your preferences.
© HealthcareDegreeSearch.com – All Rights Reserved.