Allied Health Professions at University of Evansville
What traits are you looking for in a school for Allied Health Professions, consider the program at University of Evansville. Get started with the following essential facts.
University of Evansville is located in Evansville, IN.
In the most recent year for which we have data, 50 allied health professions degrees were awarded at University of Evansville.
Featured schools near , edit
Online Class Availability at University of Evansville
Distance learning is available at University of Evansville. Among 2,114 students, 60 (3%) were enrolled entirely in distance education and 677 (32%) took at least some classes online.
Allied Health Professions Rankings at University of Evansville
Rankings can help you compare University of Evansville’s Allied Health Professions program against other schools offering the same major.
Bachelor’s-Level Rankings
| Ranking | Scope | Rank |
|---|---|---|
| Best Schools (Quality) | Indiana | #9 of 17 |
| Best Value | Indiana | #10 of 17 |
| Best Schools (Quality) | Great Lakes (Region) | #77 of 188 |
| Best Value | Great Lakes (Region) | #137 of 178 |
| Best Schools (Quality) | Nationwide | #542 of 1,196 |
| Best Value | Nationwide | #852 of 1,196 |
Master’s-Level Rankings
| Ranking | Scope | Rank |
|---|---|---|
| Best Schools (Quality) | Indiana | #9 of 17 |
| Best Value | Indiana | #10 of 17 |
| Best Schools (Quality) | Great Lakes (Region) | #77 of 188 |
| Best Value | Great Lakes (Region) | #137 of 178 |
| Best Schools (Quality) | Nationwide | #542 of 1,196 |
| Best Value | Nationwide | #852 of 1,196 |
Median Debt at Graduation
Typical debt at graduation for Allied Health Professions graduates from University of Evansville is $27,000.
Student Demographics & Diversity
Below you’ll find the diversity of Allied Health Professions graduates at University of Evansville, by degree type.
Looking at the program as a whole, Allied Health Professions graduates at University of Evansville are 66% women (33) and 34% men (17).
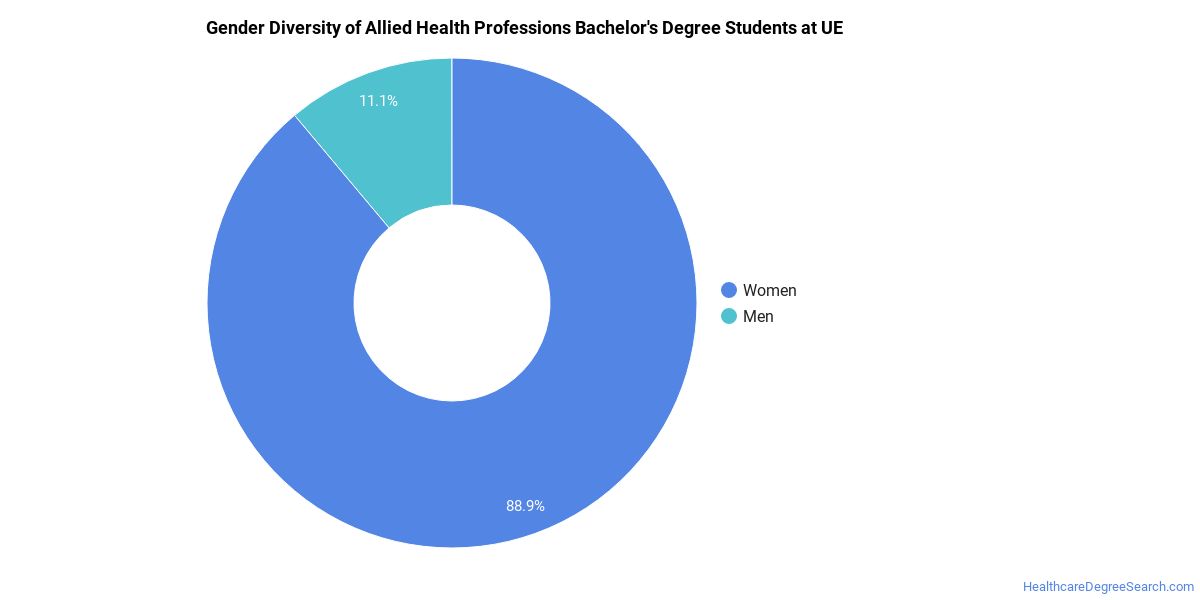
Allied Health Professions Bachelor’s Program at University of Evansville
Of the 7 bachelor’s allied health professions graduates at University of Evansville, 71% were women (5) and 29% were men (2).
The following table and chart show the race/ethnicity of Allied Health Professions bachelor’s degree recipients at University of Evansville.
| Race / Ethnicity | Number of Graduates |
|---|---|
| White | 5 |
| Two or More Races | 1 |
| International (Nonresident) | 1 |
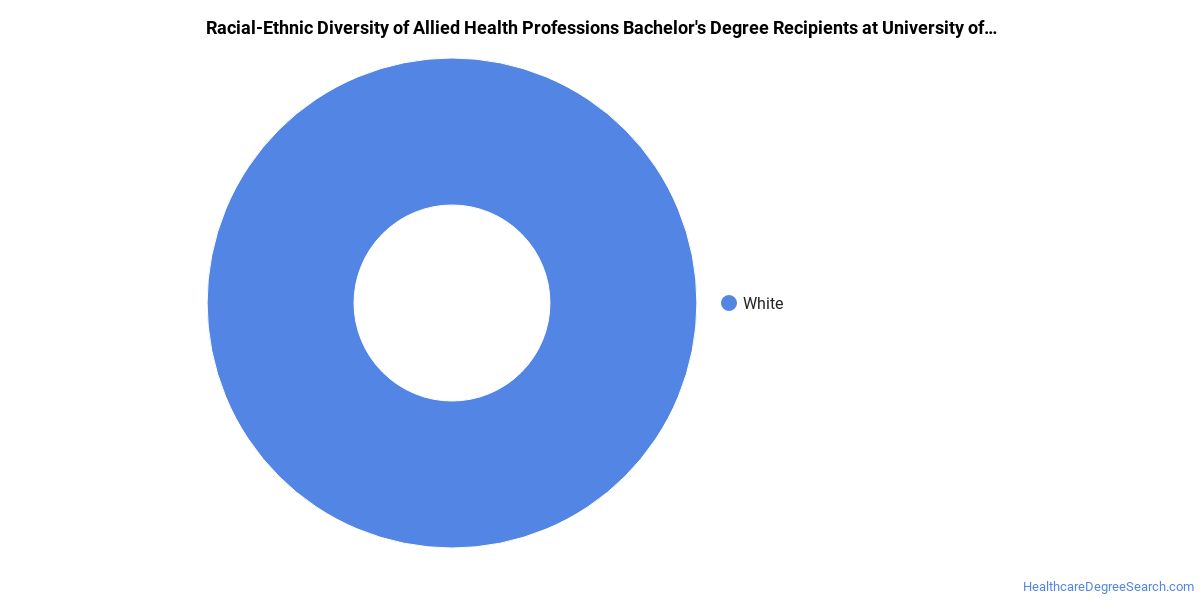
Racial-ethnic minorities make up 14% of Allied Health Professions bachelor’s degree recipients at University of Evansville, lower than the national average of 33%.*
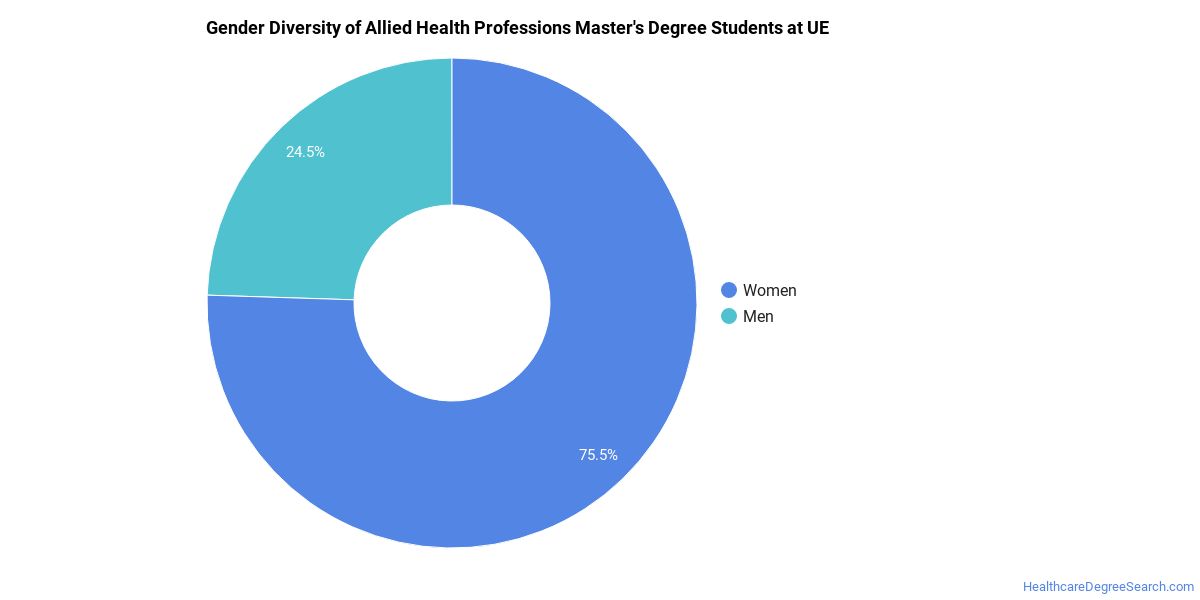
Allied Health Professions Master’s Program at University of Evansville
Of the 43 master’s allied health professions degrees awarded at University of Evansville, 65% were women (28) and 35% were men (15).
The following table and chart show the race/ethnicity of Allied Health Professions master’s degree recipients at University of Evansville.
| Race / Ethnicity | Number of Graduates |
|---|---|
| White | 31 |
| Asian | 2 |
| Two or More Races | 1 |
| International (Nonresident) | 3 |
| Unknown | 6 |
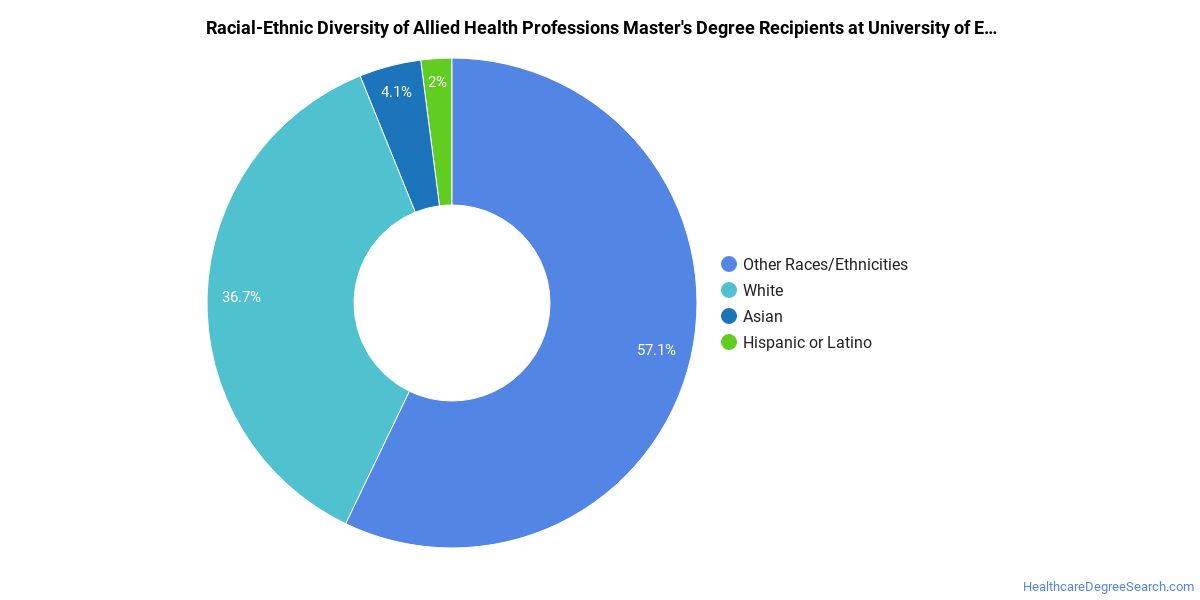
Minority students account for 7% of Allied Health Professions master’s degree recipients at University of Evansville, below the national average of 29%.*
*The racial-ethnic minorities figure is the total number of graduates minus White, international (nonresident), and unknown-race graduates.
More Specific Allied Health Professions Concentrations at University of Evansville
This Allied Health Professions program at University of Evansville includes the following sub-specializations:
| Concentration | Graduates |
|---|---|
| Physician Assistant | 37 |
| Athletic Training | 13 |
Highest-Paying Careers for Allied Health Professions Graduates
Graduates of the Allied Health Professions program at University of Evansville work across a variety of fields. The table below ranks the highest-paying careers for Allied Health Professions majors, ordered by median annual salary:
| Occupation | Nationwide Median Wage |
|---|---|
| Health Technologists and Technicians, All Other | $153,940 |
| Ophthalmic Medical Technologists | $153,819 |
| Surgical Assistants | $141,004 |
| Radiologic Technologists and Technicians | $137,802 |
| Respiratory Therapists | $128,345 |
| Nuclear Medicine Technologists | $119,042 |
| Anesthesiologist Assistants | $116,229 |
| Nuclear Monitoring Technicians | $115,968 |
| Emergency Medical Technicians | $105,175 |
| Hearing Aid Specialists | $96,168 |
References
- IPEDS — Integrated Postsecondary Education Data System
- U.S. Department of Education — College Scorecard
- O*NET Online (Bureau of Labor Statistics)
- National Center for Education Statistics
More about our data sources and methodologies.
HealthcareDegreeSearch.com provides higher-education, college and university, degree, program, career, salary, and other helpful information to students, faculty, institutions, and other internet audiences. Presented information and data are subject to change. Inclusion on this website does not imply or represent a direct relationship with the company, school, or brand. Information, though believed correct at time of publication, may not be correct, and no warranty is provided. Contact the schools to verify any information before relying on it. Financial aid may be available for those who qualify. The displayed options may include sponsored or recommended results, not necessarily based on your preferences.
© HealthcareDegreeSearch.com – All Rights Reserved.