Health Sciences & Services at Utica University
If you are interested in studying Health Sciences & Services, consider the program at Utica University. Get started with the following essential facts.
Utica University sits in Utica, NY.
During the most recent reporting year, 88 health sciences & services graduations were recorded at Utica University.
Featured schools near , edit
Studying Online at Utica University
Online coursework is an option at Utica University. Among 3,627 students, 1,548 (43%) were enrolled entirely in distance education and 1,024 (28%) took at least some classes online.
Health Sciences & Services Rankings at Utica University
Use these rankings to compare Utica University’s Health Sciences & Services program against peer institutions.
Bachelor’s-Level Rankings
| Ranking | Scope | Rank |
|---|---|---|
| Best Schools (Quality) | New York | #16 of 37 |
| Best Value | New York | #26 of 35 |
| Best Schools (Quality) | Middle Atlantic (Region) | #40 of 86 |
| Best Value | Middle Atlantic (Region) | #57 of 84 |
| Best Schools (Quality) | Nationwide | #154 of 478 |
| Best Value | Nationwide | #364 of 471 |
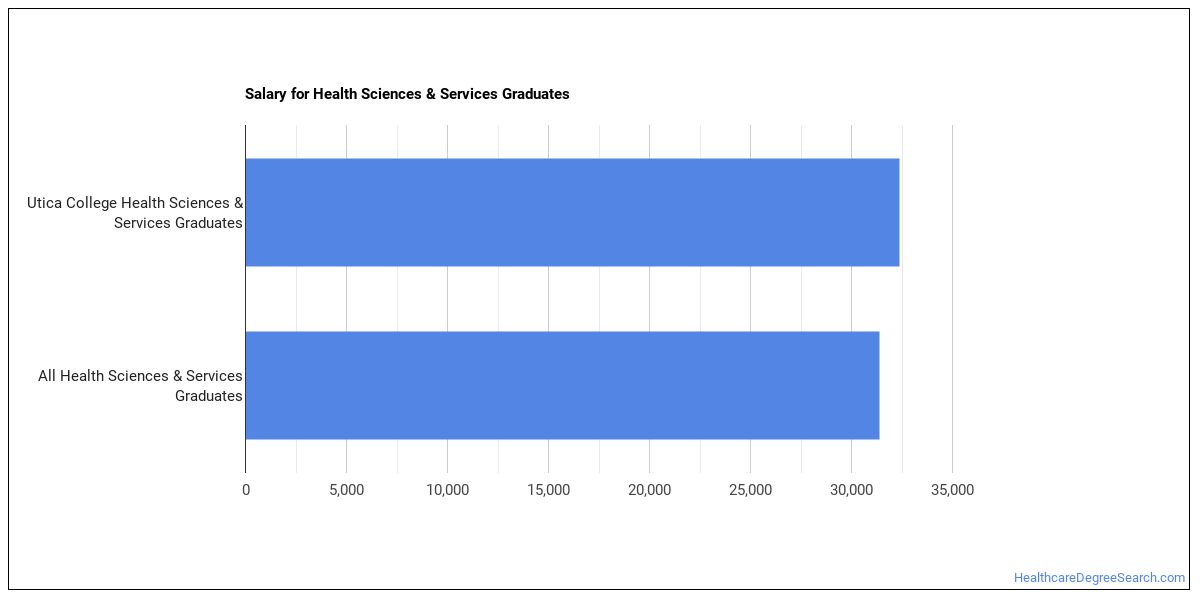
Earnings for Health Sciences & Services Graduates from Utica University
Graduates of Utica University’s Health Sciences & Services program earn the following amounts (per the U.S. Department of Education’s College Scorecard):
| Years After Graduation | Median Earnings |
|---|---|
| 1 year | $32,371 |
| 2 years | $25,194 |
| 3 years | $38,775 |
| 4 years | $53,548 |
| 5 years | $57,065 |
Is this above or below average for the school? Four years after graduating, Health Sciences & Services graduates from Utica University report median earnings of $53,548, compared with $72,003 for all Utica University graduates — about 26% lower than the school-wide median.

Median Debt at Graduation
Median student loan debt for Health Sciences & Services graduates from Utica University comes in at $26,988.
Student Demographics & Diversity
Below you’ll find the diversity of Health Sciences & Services graduates at Utica University, broken down by degree level.
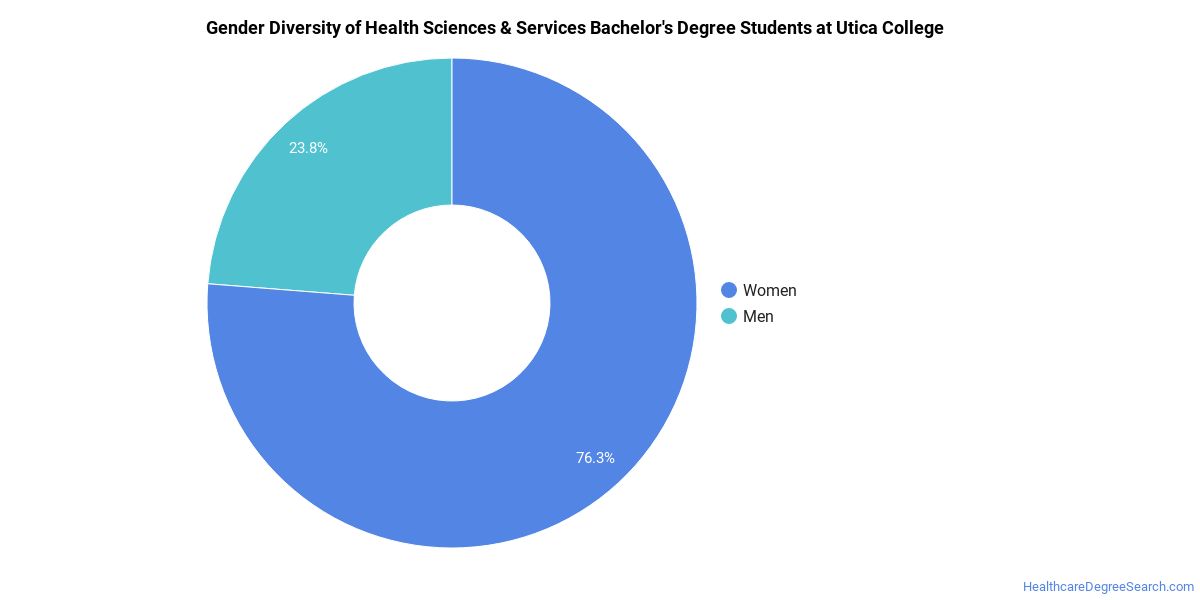
Looking at the program as a whole, Health Sciences & Services graduates at Utica University are 75% women (66) and 25% men (22).
Health Sciences & Services Bachelor’s Program at Utica University
Of the 88 bachelor’s health sciences & services graduates at Utica University, 75% were women (66) and 25% were men (22).
The following table and chart show the race/ethnicity of Health Sciences & Services bachelor’s degree recipients at Utica University.
| Race / Ethnicity | Number of Graduates |
|---|---|
| White | 69 |
| Hispanic / Latino | 4 |
| Black / African American | 5 |
| Asian | 5 |
| American Indian / Alaska Native | 1 |
| Two or More Races | 1 |
| International (Nonresident) | 2 |
| Unknown | 1 |
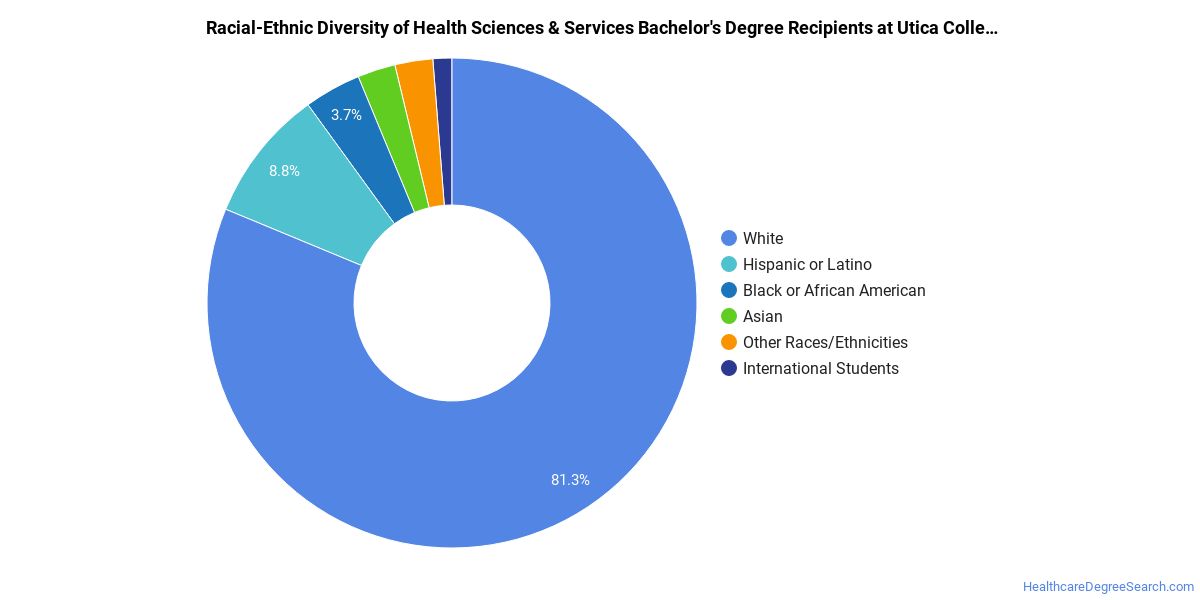
Racial-ethnic minorities make up 18% of Health Sciences & Services bachelor’s degree recipients at Utica University, lower than the national average of 50%.*
*The racial-ethnic minorities figure is the total number of graduates minus White, international (nonresident), and unknown-race graduates.
More Specific Health Sciences & Services Concentrations at Utica University
The Health Sciences & Services program at Utica University breaks down into more specific concentrations:
| Concentration | Graduates |
|---|---|
| General/Allied Health Sciences | 88 |
Best-Paid Careers for Health Sciences & Services Graduates
Students who finish Health Sciences & Services program at Utica University work across a variety of fields. Here are the highest-paying careers for Health Sciences & Services majors, ordered by median annual salary:
| Occupation | Nationwide Median Wage |
|---|---|
| Health Education Specialists | $81,726 |
| Community Health Workers | $73,901 |
References
- IPEDS — Integrated Postsecondary Education Data System
- U.S. Department of Education — College Scorecard
- O*NET Online (Bureau of Labor Statistics)
- National Center for Education Statistics
More about our data sources and methodologies.
HealthcareDegreeSearch.com provides higher-education, college and university, degree, program, career, salary, and other helpful information to students, faculty, institutions, and other internet audiences. Presented information and data are subject to change. Inclusion on this website does not imply or represent a direct relationship with the company, school, or brand. Information, though believed correct at time of publication, may not be correct, and no warranty is provided. Contact the schools to verify any information before relying on it. Financial aid may be available for those who qualify. The displayed options may include sponsored or recommended results, not necessarily based on your preferences.
© HealthcareDegreeSearch.com – All Rights Reserved.