Health Sciences & Services at Westfield State University
If you are interested in studying Health Sciences & Services, you may want to check out the program at Westfield State University. We’ve gathered the following information to help you decide.
Westfield State University sits in Westfield, MA.
In the most recent year for which we have data, 40 health sciences & services degrees were granted at Westfield State University.
Featured schools near , edit
Online & Distance Learning at Westfield State University
Distance learning is available at Westfield State University. Among 4,588 students, 515 (11%) studied exclusively online and 2,058 (45%) took at least some classes online.
Health Sciences & Services Rankings at Westfield State University
Use these rankings to compare Westfield State University’s Health Sciences & Services program against peer institutions.
Bachelor’s-Level Rankings
| Ranking | Scope | Rank |
|---|---|---|
| Best Schools (Quality) | Massachusetts | #3 of 16 |
| Best Schools (Quality) | New England (Region) | #6 of 38 |
| Best Value | Massachusetts | #7 of 17 |
| Best Value | New England (Region) | #11 of 39 |
| Best Schools (Quality) | Nationwide | #88 of 478 |
| Best Value | Nationwide | #310 of 471 |
Student Demographics & Diversity
The following sections describe the composition of Health Sciences & Services graduates at Westfield State University, broken down by degree level.
Program-wide, Health Sciences & Services graduates at Westfield State University are 80% women (32) and 20% men (8).
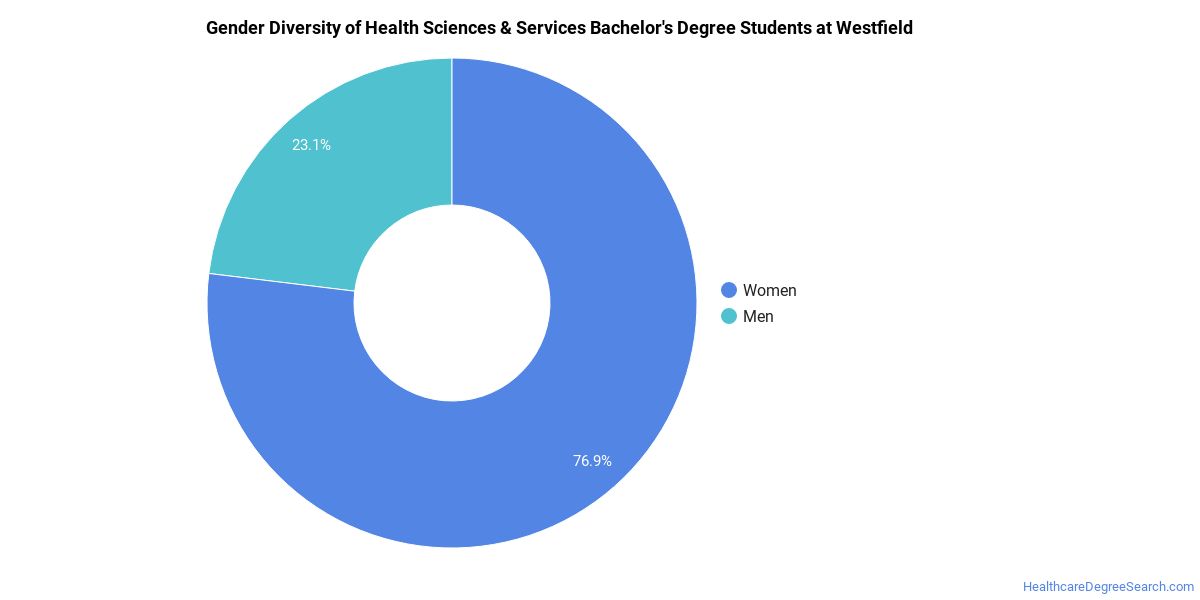
Health Sciences & Services Bachelor’s Program at Westfield State University
Among the 40 bachelor’s health sciences & services graduates at Westfield State University, 80% were women (32) and 20% were men (8).
The following table and chart show the race/ethnicity of Health Sciences & Services bachelor’s degree recipients at Westfield State University.
| Race / Ethnicity | Number of Graduates |
|---|---|
| White | 28 |
| Black / African American | 5 |
| Asian | 3 |
| Two or More Races | 3 |
| Unknown | 1 |

Racial-ethnic minorities make up 28% of Health Sciences & Services bachelor’s degree recipients at Westfield State University, lower than the national average of 50%.*
*The racial-ethnic minorities figure is the total number of graduates minus White, international (nonresident), and unknown-race graduates.
More Specific Health Sciences & Services Concentrations at Westfield State University
This Health Sciences & Services program at Westfield State University includes the following sub-specializations:
| Concentration | Graduates |
|---|---|
| General/Allied Health Sciences | 40 |
Top-Paying Careers for Health Sciences & Services Graduates
Graduates of the Health Sciences & Services program at Westfield State University work across a variety of fields. Below are the top-paying careers for Health Sciences & Services graduates, ordered by median annual salary:
| Occupation | Nationwide Median Wage |
|---|---|
| Health Education Specialists | $81,726 |
| Community Health Workers | $73,901 |
References
- IPEDS — Integrated Postsecondary Education Data System
- U.S. Department of Education — College Scorecard
- O*NET Online (Bureau of Labor Statistics)
- National Center for Education Statistics
More about our data sources and methodologies.
HealthcareDegreeSearch.com provides higher-education, college and university, degree, program, career, salary, and other helpful information to students, faculty, institutions, and other internet audiences. Presented information and data are subject to change. Inclusion on this website does not imply or represent a direct relationship with the company, school, or brand. Information, though believed correct at time of publication, may not be correct, and no warranty is provided. Contact the schools to verify any information before relying on it. Financial aid may be available for those who qualify. The displayed options may include sponsored or recommended results, not necessarily based on your preferences.
© HealthcareDegreeSearch.com – All Rights Reserved.