Movement & Mind-Body Therapies Basic Certificates
There are 20 schools in the United States where you can earn abasic certificate in Movement & Mind-Body Therapies. Among those who recently graduated from the schools offering this degree, the majority were women, and46% were students from underrepresented racial-ethnic groups.
Featured schools near , edit
Education Levels of Movement & Mind-Body Therapies Majors
In the most recent year for which data is available, 575 degrees were awarded toMovement & Mind-Body Therapies majors across all award levels. The following table shows the number of diplomas awarded in Movement & Mind-Body Therapies at each degree level.
| Education Level | Number of Grads |
|---|---|
| Certificate | 6 |
| Associate’s Degree | 74 |
| Bachelor’s Degree | 51 |
| Master’s Degree | 436 |
| Doctor’s Degree | 6 |
Earnings of Movement & Mind-Body Therapies Majors With Basic Certificates (All Award Levels)
The U.S. Department of Education reports a median salary for graduates with abasic certificate in Movement & Mind-Body Therapies of $24,770 four years after graduation. These figures are reported program-wide, across all award levels.
However, this can depend on a number of factors, such as where you live and the number of years of experience you have.
| Years After Graduation | Median Earnings |
|---|---|
| 1 year | $26,390 |
| 4 years | $24,770 |
| 5 years | $33,461 |
Source: U.S. Department of Education College Scorecard, field-of-study earnings tracker (program-wide, all award levels).
Student Debt (All Award Levels)
The data on debt ranges for Movement & Mind-Body Therapies majors who have their basic certificate is not currently available.
Student Diversity
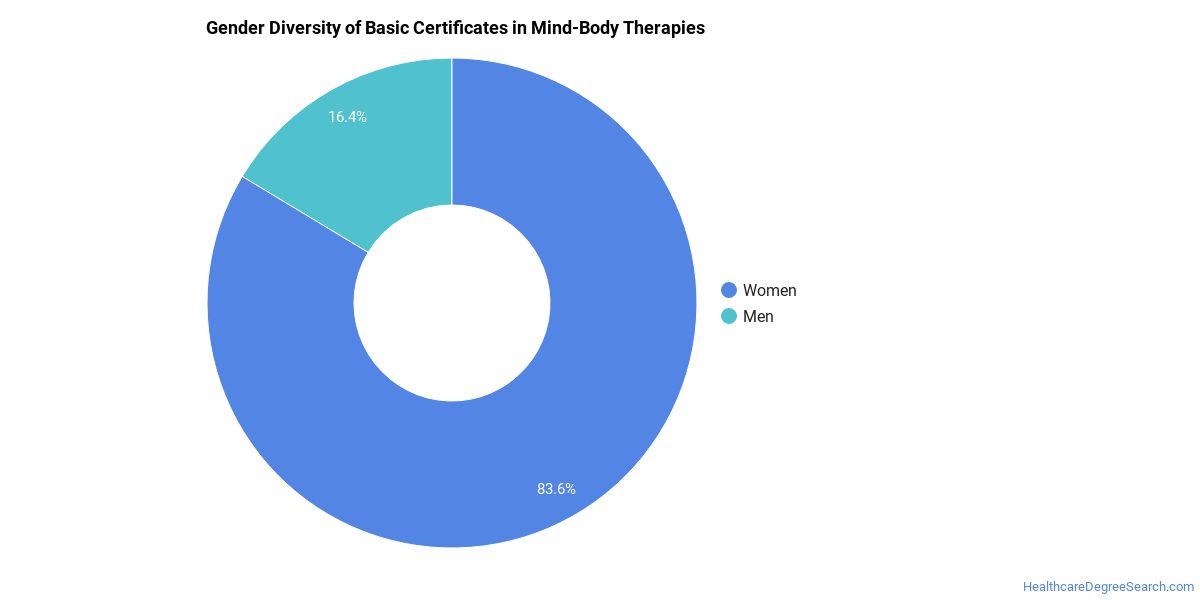
This degree is more popular with female students. About 79.7% of graduates with this degree are women.
| Gender | Number of Grads |
|---|---|
| Men | 77 |
| Women | 303 |
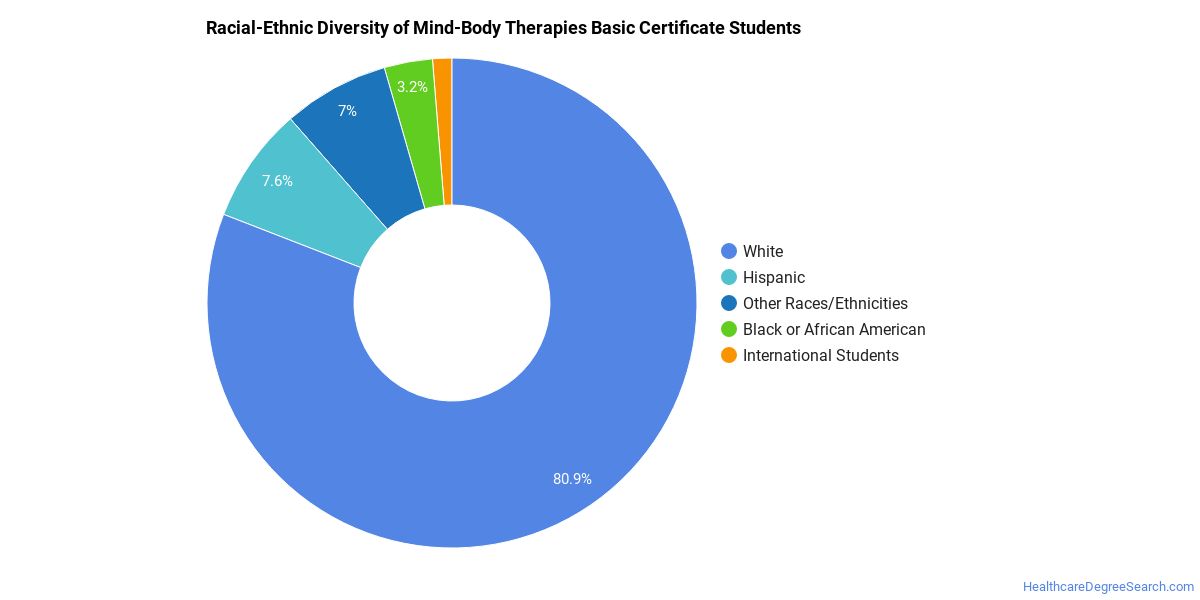
The racial-ethnic distribution of Movement & Mind-Body Therapies graduates is as follows:
| Race / Ethnicity | Number of Grads | Share |
|---|---|---|
| White | 204 | 53.7% |
| Asian | 20 | 5.3% |
| Hispanic or Latino | 47 | 12.4% |
| Black or African American | 42 | 11.1% |
| American Indian / Alaska Native | 3 | 0.8% |
| Native Hawaiian / Pacific Islander | 2 | 0.5% |
| Two or More Races | 46 | 12.1% |
| Race Unknown | 16 | 4.2% |
See the minority definition in the References below.
Most Popular Movement & Mind-Body Therapies Programs for Basic Certificates
There are 28 colleges that offer a basic certificate in Movement & Mind-Body Therapies. Learn more about the most popular below:

Hypnosis Motivation Institute tops the list of the most popular schools in the U.S. for Movement & Mind-Body Therapies majors seeking their basic certificate. During the most recent year for which we have data, 395 people received their basic certificate in Movement & Mind-Body Therapies from this school. Data shows that graduates who hold this degree go on to make a median salary of $40,669.
Texas Christian University is a popular choice for Movement & Mind-Body Therapies majors seeking their basic certificate. During the most recent year for which we have data, 37 people received their basic certificate in Movement & Mind-Body Therapies from this school. Graduates who complete their basic certificate in Movement & Mind-Body Therapies here go on to a median salary of $40,669.
Maryland University of Integrative Health comes in at #3 on our list of the most popular colleges offering basic certificates in Movement & Mind-Body Therapies. During the most recent year for which we have data, 21 people received their basic certificate in Movement & Mind-Body Therapies from this school. Data shows that graduates who hold this degree go on to make a median salary of $40,669.
Antioch University-New England comes in at #4 on our list of the most popular colleges offering basic certificates in Movement & Mind-Body Therapies. This school awarded 16 basic certificates in Movement & Mind-Body Therapies in the most recent reporting year. Graduates who complete their basic certificate in Movement & Mind-Body Therapies here go on to a median salary of $40,669.
Scottsdale Community College comes in at #5 on our list of the most popular colleges offering basic certificates in Movement & Mind-Body Therapies. This school awarded 16 basic certificates in Movement & Mind-Body Therapies in the most recent reporting year. Graduates who complete their basic certificate in Movement & Mind-Body Therapies here go on to a median salary of $40,669.
Loyola Marymount University is a popular choice for Movement & Mind-Body Therapies majors seeking their basic certificate. This school awarded 14 basic certificates in Movement & Mind-Body Therapies in the most recent reporting year. Graduates who complete their basic certificate in Movement & Mind-Body Therapies here go on to a median salary of $40,669.
Southwest Institute of Healing Arts comes in at #7 on our list of the most popular colleges offering basic certificates in Movement & Mind-Body Therapies. This school awarded 14 basic certificates in Movement & Mind-Body Therapies in the most recent reporting year. Graduates who complete their basic certificate in Movement & Mind-Body Therapies here go on to a median salary of $40,669.
CUNY York College is a popular choice for Movement & Mind-Body Therapies majors seeking their basic certificate. During the most recent year for which we have data, 12 people received their basic certificate in Movement & Mind-Body Therapies from this school. Graduates who complete their basic certificate in Movement & Mind-Body Therapies here go on to a median salary of $40,669.
University of Cincinnati-Main Campus is a popular choice for Movement & Mind-Body Therapies majors seeking their basic certificate. During the most recent year for which we have data, 11 people received their basic certificate in Movement & Mind-Body Therapies from this school. Graduates who complete their basic certificate in Movement & Mind-Body Therapies here go on to a median salary of $40,669.
Pacific College of Health and Science is a popular choice for Movement & Mind-Body Therapies majors seeking their basic certificate. During the most recent year for which we have data, 10 people received their basic certificate in Movement & Mind-Body Therapies from this school. Graduates who complete their basic certificate in Movement & Mind-Body Therapies here go on to a median salary of $40,669.
Western New Mexico University is a popular choice for Movement & Mind-Body Therapies majors seeking their basic certificate. This school awarded 7 basic certificates in Movement & Mind-Body Therapies in the most recent reporting year. Data shows that graduates who hold this degree go on to make a median salary of $40,669.
University of North Carolina at Chapel Hill is a popular choice for Movement & Mind-Body Therapies majors seeking their basic certificate. During the most recent year for which we have data, 6 people received their basic certificate in Movement & Mind-Body Therapies from this school. Data shows that graduates who hold this degree go on to make a median salary of $40,669.
Southeastern University comes in at #13 on our list of the most popular colleges offering basic certificates in Movement & Mind-Body Therapies. During the most recent year for which we have data, 4 people received their basic certificate in Movement & Mind-Body Therapies from this school. Data shows that graduates who hold this degree go on to make a median salary of $40,669.
Milwaukee Area Technical College is a popular choice for Movement & Mind-Body Therapies majors seeking their basic certificate. During the most recent year for which we have data, 2 people received their basic certificate in Movement & Mind-Body Therapies from this school. Graduates who complete their basic certificate in Movement & Mind-Body Therapies here go on to a median salary of $40,669.
Naropa University is a popular choice for Movement & Mind-Body Therapies majors seeking their basic certificate. This school awarded 2 basic certificates in Movement & Mind-Body Therapies in the most recent reporting year. Graduates who complete their basic certificate in Movement & Mind-Body Therapies here go on to a median salary of $40,669.
Portland Community College comes in at #16 on our list of the most popular colleges offering basic certificates in Movement & Mind-Body Therapies. This school awarded 2 basic certificates in Movement & Mind-Body Therapies in the most recent reporting year. Data shows that graduates who hold this degree go on to make a median salary of $40,669.
Saint Paul College is a popular choice for Movement & Mind-Body Therapies majors seeking their basic certificate. This school awarded 2 basic certificates in Movement & Mind-Body Therapies in the most recent reporting year. Data shows that graduates who hold this degree go on to make a median salary of $40,669.
West Chester University of Pennsylvania comes in at #18 on our list of the most popular colleges offering basic certificates in Movement & Mind-Body Therapies. This school awarded 2 basic certificates in Movement & Mind-Body Therapies in the most recent reporting year. Data shows that graduates who hold this degree go on to make a median salary of $40,669.
Linfield University is a popular choice for Movement & Mind-Body Therapies majors seeking their basic certificate. During the most recent year for which we have data, 1 people received their basic certificate in Movement & Mind-Body Therapies from this school. Data shows that graduates who hold this degree go on to make a median salary of $40,669.
Thomas Jefferson University is a popular choice for Movement & Mind-Body Therapies majors seeking their basic certificate. During the most recent year for which we have data, 1 people received their basic certificate in Movement & Mind-Body Therapies from this school. Data shows that graduates who hold this degree go on to make a median salary of $40,669.
Movement & Mind-Body Therapies Concentrations
| Major | Annual Degrees Awarded |
|---|---|
| Hypnotherapy/Hypnotherapist | 399 |
| Yoga Teacher Training/Yoga Therapy | 98 |
| Movement Therapy and Movement Education | 75 |
| Movement and Mind-Body Therapies and Education, Other | 3 |
Explore Movement & Mind-Body Therapies by State
Alabama
California
District of Columbia
Idaho
Kansas
Maryland
Mississippi
Nevada
New York
Oklahoma
South Carolina
Utah
West Virginia
Alaska
Colorado
Florida
Illinois
Kentucky
Massachusetts
Missouri
New Hampshire
North Carolina
Oregon
South Dakota
Vermont
Wisconsin
Related Majors
Below are some popular majors similar to Movement & Mind-Body Therapies that also offer basic certificates.
References
The racial-ethnic minority student count is calculated by taking the total number of students and subtracting white students, international students, and students whose race/ethnicity was unknown. This number is then divided by the total number of students to obtain the percentage of racial-ethnic minorities.
- College Factual
- National Center for Education Statistics (IPEDS)
- O*NET Online
- U.S. Bureau of Labor Statistics
- U.S. Department of Education College Scorecard
More about our data sources and methodologies.
HealthcareDegreeSearch.com provides higher-education, college and university, degree, program, career, salary, and other helpful information to students, faculty, institutions, and other internet audiences. Presented information and data are subject to change. Inclusion on this website does not imply or represent a direct relationship with the company, school, or brand. Information, though believed correct at time of publication, may not be correct, and no warranty is provided. Contact the schools to verify any information before relying on it. Financial aid may be available for those who qualify. The displayed options may include sponsored or recommended results, not necessarily based on your preferences.
© HealthcareDegreeSearch.com – All Rights Reserved.