Healthcare Practitioners and Technical Workers, All Other: Career Overview
All healthcare practitioners and technical workers not listed separately.
Featured schools near , edit
What Do Healthcare Practitioners and Technical Workers, All Other Take On?
Other Healthcare Practitioners and Technical Workers, All Other Job Titles
Common job titles for this role include:
- Central Supply Technician
- Child Health Associate
- Drug Coordinator
- Extracorporeal Technician
- Health Service Coordinator
- Kinesiologist
- Medical Consultant
- Pheresis Specialist
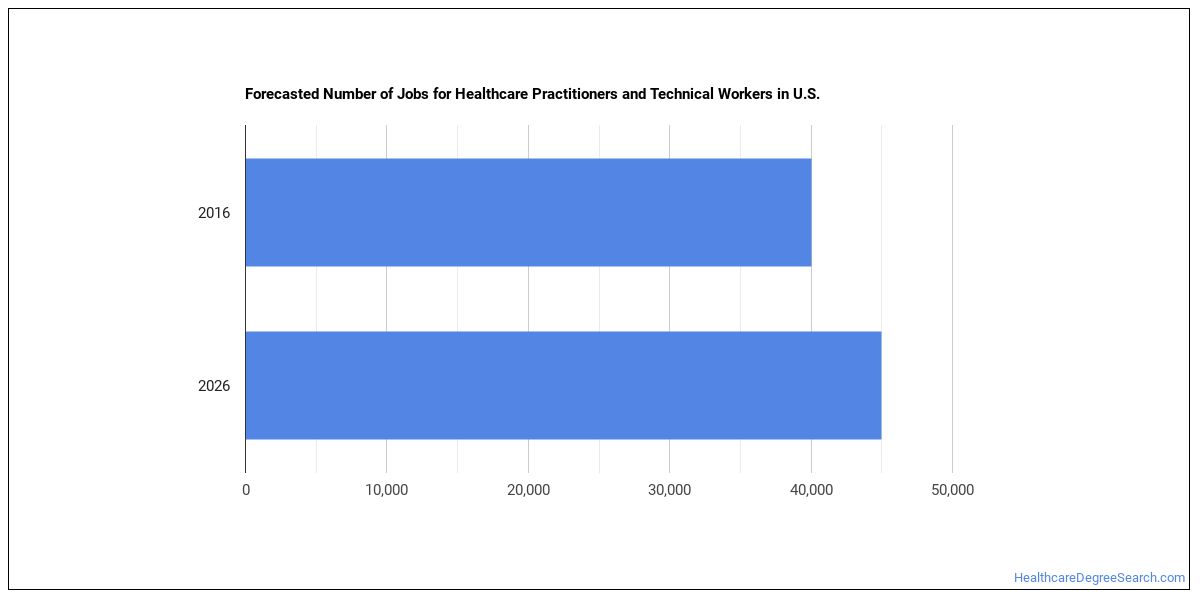
Employment and Demand
There are about 1,850,208 healthcare practitioners and technical workers, all other working in the United States today. This occupation is expected to grow by +14.6% over the projection horizon.
Salary for Healthcare Practitioners and Technical Workers, All Other
| Statistic | Value |
|---|---|
| Annual median | $117,846 |
| Hourly median | $56.66 |
| 10th percentile | $72,415 |
| 25th percentile | $95,130 |
| 75th percentile | $140,561 |
| 90th percentile | $163,276 |
Compensation varies based on experience, location, and industry.

How Much Do Healthcare Practitioners and Technical Workers, All Other Make in Different U.S. States?
| State | Annual median salary |
|---|---|
| District of Columbia | $107,490 |
| Puerto Rico | $107,240 |
| Indiana | $87,870 |
| New York | $84,050 |
| Wisconsin | $78,790 |
| Kentucky | $78,610 |
| Minnesota | $78,300 |
| New Hampshire | $77,310 |
| Michigan | $76,530 |
| Virginia | $76,450 |
| California | $75,070 |
| Maryland | $74,010 |
| Oregon | $73,850 |
| New Jersey | $73,640 |
| Maine | $72,200 |
| Alaska | $72,030 |
| New Mexico | $71,920 |
| Washington | $69,440 |
| North Carolina | $68,880 |
| Missouri | $67,440 |
| Massachusetts | $67,000 |
| Louisiana | $66,190 |
| Arizona | $65,830 |
| Vermont | $65,450 |
| Oklahoma | $63,960 |
| Georgia | $63,900 |
| South Carolina | $63,890 |
| Montana | $62,920 |
| Ohio | $62,530 |
| Utah | $62,110 |
| Idaho | $60,370 |
| Colorado | $60,360 |
| Wyoming | $58,110 |
| Florida | $57,190 |
| Illinois | $57,020 |
| Tennessee | $54,990 |
| Hawaii | $53,520 |
| West Virginia | $51,440 |
| Nebraska | $51,350 |
| Nevada | $51,170 |
| Alabama | $51,060 |
| North Dakota | $50,760 |
| Texas | $50,290 |
| Connecticut | $49,200 |
| Rhode Island | $48,650 |
| Delaware | $47,570 |
| Pennsylvania | $43,840 |
| Kansas | $42,760 |
| Arkansas | $39,390 |
| Iowa | $36,670 |
| Mississippi | $36,480 |
Pay by U.S. Region
Earnings for healthcare practitioners and technical workers, all other differ across the country. These regions lead on median pay:
| Region | Median annual wage | Share of U.S. jobs | Location quotient |
|---|---|---|---|
| Other U.S. Territories | $107,240 | 0.1% | 0.24 |
| Great Lakes | $73,180 | 9.4% | 0.75 |
| Far Western US | $68,403 | 19.2% | 1.72 |
| Middle Atlantic | $65,415 | 21.1% | 2.25 |
| Southeast | $61,456 | 32.0% | 3.61 |
| Plains States | $61,027 | 4.9% | 0.77 |
| Rocky Mountains | $60,898 | 1.9% | 0.53 |
| New England | $59,346 | 5.1% | 1.85 |
Highest-Paying Metro Areas for Healthcare Practitioners and Technical Workers, All Other
| Metro area | State | Median annual wage | Employment |
|---|---|---|---|
| San Jose-Sunnyvale-Santa Clara, CA | CA | $118,470 | 280 |
| San Juan-Bayamon-Caguas, PR | PR | $107,240 | 40 |
| Lansing-East Lansing, MI | MI | $99,360 | 90 |
| Washington-Arlington-Alexandria, DC-VA-MD-WV | DC | $97,850 | 1,310 |
| Louisville/Jefferson County, KY-IN | KY | $95,640 | 60 |
| Omaha, NE-IA | NE | $91,830 | 90 |
| San Francisco-Oakland-Fremont, CA | CA | $90,210 | 510 |
| Bremerton-Silverdale-Port Orchard, WA | WA | $86,960 | 30 |
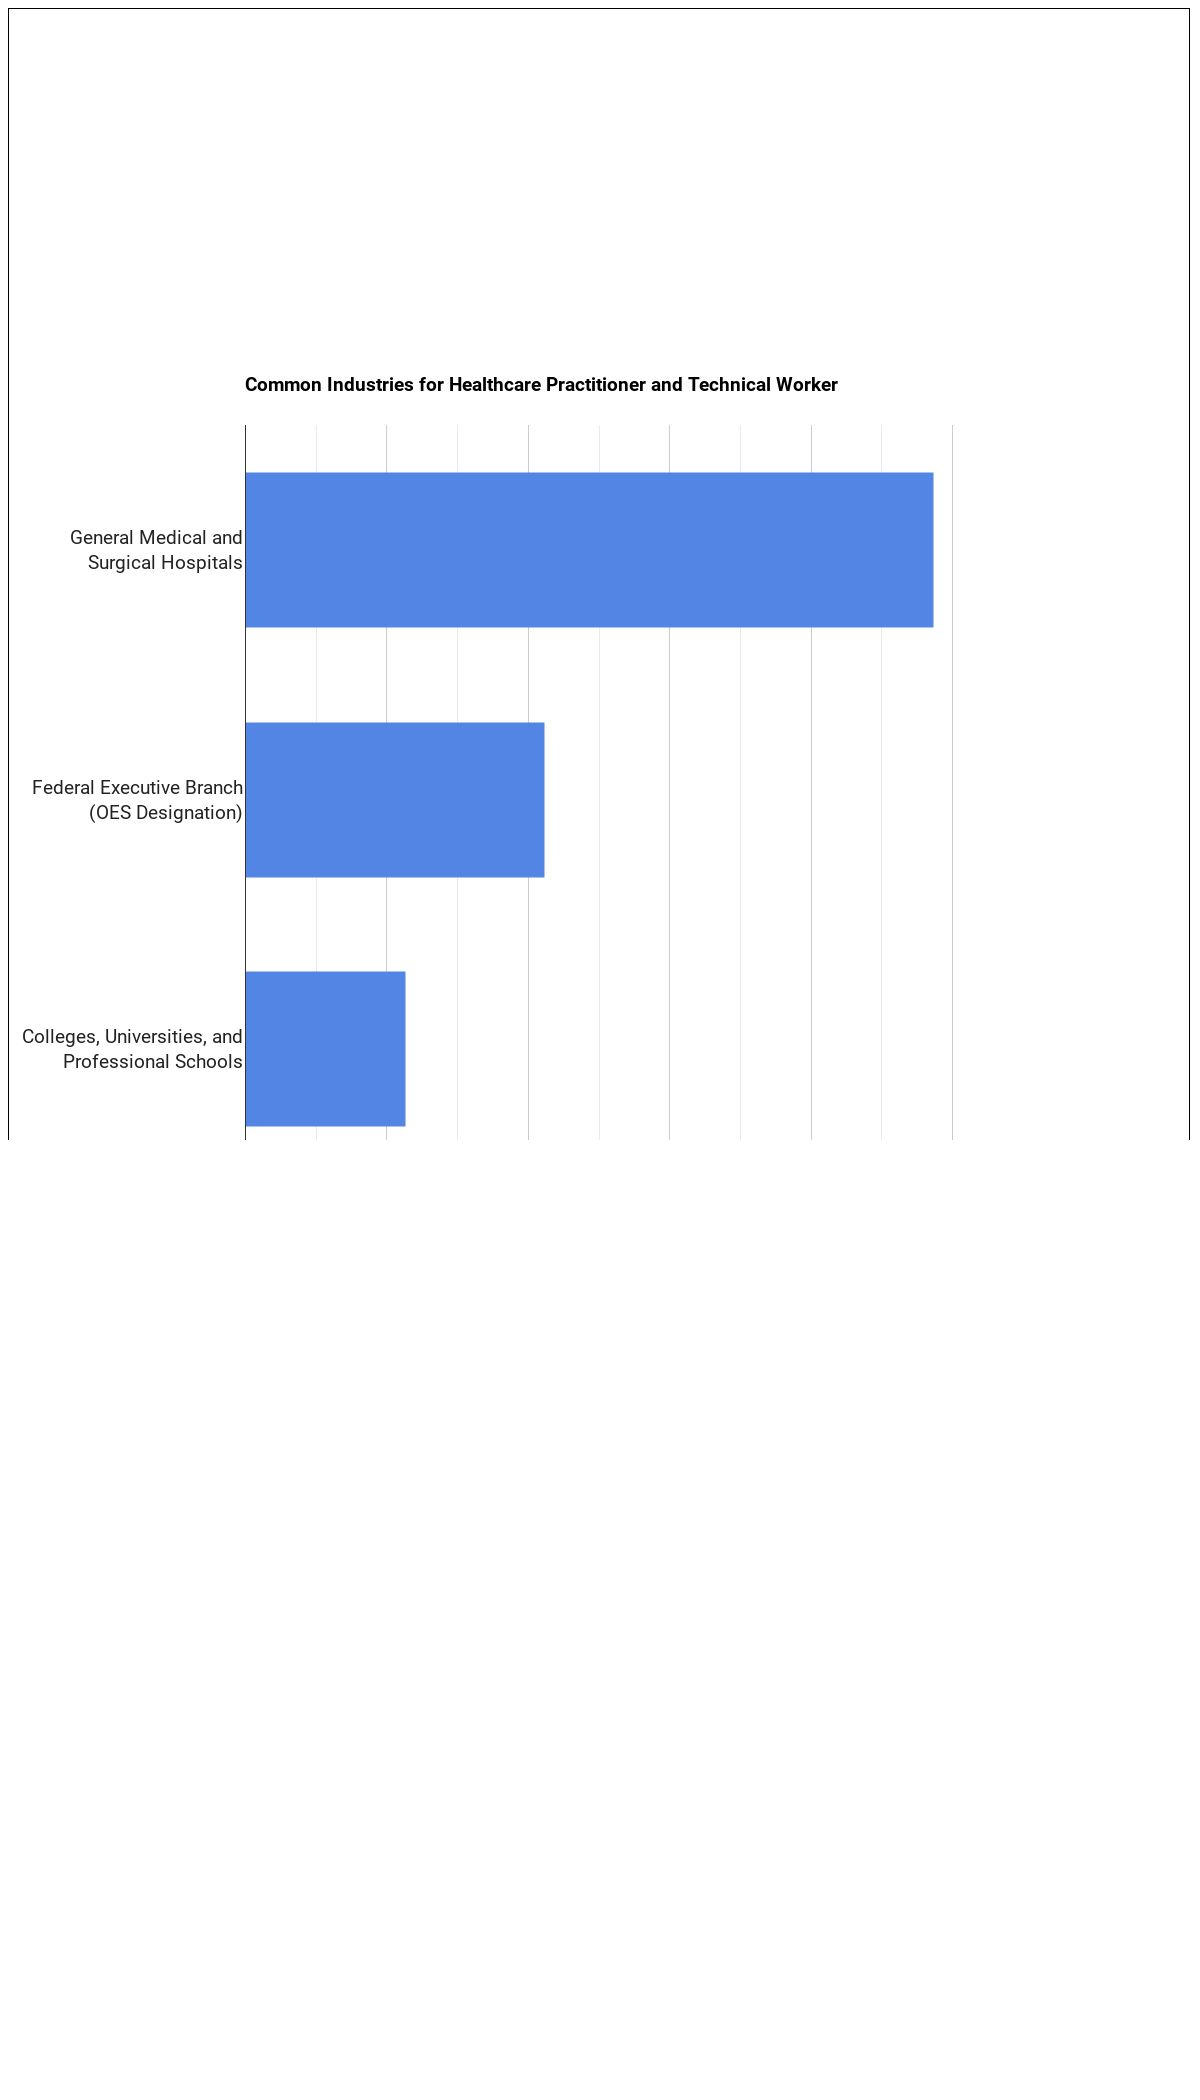
Top Industries Employing Healthcare Practitioners and Technical Workers, All Other
The largest employers of healthcare practitioners and technical workers, all other work in these industries:
| Industry | Employment | Median annual wage |
|---|---|---|
| Health Care and Social Assistance | 22,440 | $59,740 |
| Educational Services | 4,020 | $64,910 |
| Professional, Scientific, and Technical Services | 1,180 | n/a |
| Administrative and Support and Waste Management and Remediation Services | 870 | $62,750 |
| Management of Companies and Enterprises | 840 | $80,520 |
| Finance and Insurance | 750 | $77,450 |
| Wholesale Trade | 710 | $130,410 |
| Retail Trade | 430 | $41,640 |
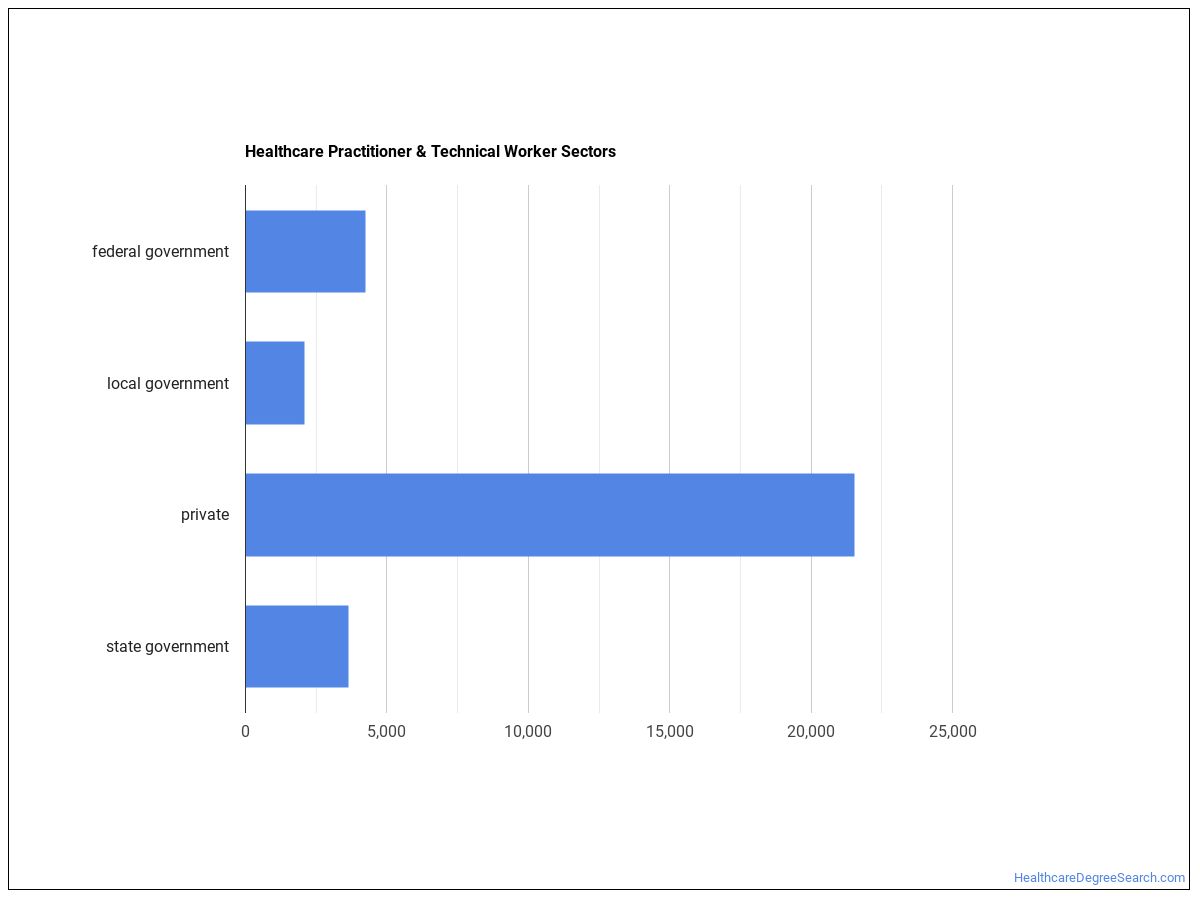
Healthcare Practitioners and Technical Workers, All Other work in the following industries:
Degree Programs
Future healthcare practitioners and technical workers, all other commonly pursue programs in:
Health Professions and Related Programs
4 programs across 4 majors
- Health/Medical Admin Services
- Bioethics/Medical Ethics
- Alternative Medicine & Systems
- Energy & Bio-Based Therapies
References
Statistics shown above are sourced from the following authoritative sources:
- U.S. Bureau of Labor Statistics — Occupational Employment and Wage Statistics (OEWS) for employment and wage data by state and industry.
- BLS Employment Projections for total employment and growth forecasts.
- O*NET (Occupational Information Network) for skills, knowledge, tasks, work activities, work context, technology, and education-zone data.
SOC code: 29-9099.00 (Healthcare Practitioners and Technical Workers, All Other).
HealthcareDegreeSearch.com provides higher-education, college and university, degree, program, career, salary, and other helpful information to students, faculty, institutions, and other internet audiences. Presented information and data are subject to change. Inclusion on this website does not imply or represent a direct relationship with the company, school, or brand. Information, though believed correct at time of publication, may not be correct, and no warranty is provided. Contact the schools to verify any information before relying on it. Financial aid may be available for those who qualify. The displayed options may include sponsored or recommended results, not necessarily based on your preferences.
© HealthcareDegreeSearch.com – All Rights Reserved.