Managers, All Other in District of Columbia
Thinking about a career as a Managers, All Other in District of Columbia? Here’s what you need to know. All managers not listed separately.
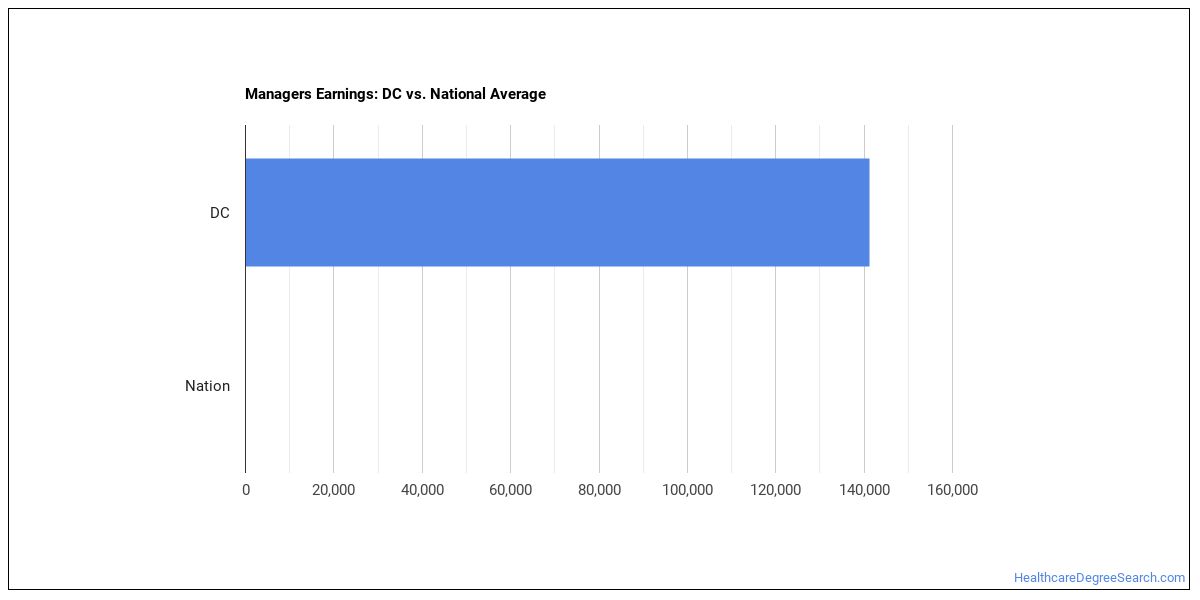
What do Managers, All Other Make in District of Columbia?
The managers, all other working in District of Columbia, the typical annual salary is $171,910 per year (or about $82.65/hour).Earnings range from $133,560 at the 10th percentile to $214,430 at the 90th percentile.
| Wage Statistic | Annual | Hourly |
|---|---|---|
| 10th percentile | $133,560 | $64.21 |
| 25th percentile | $152,070 | $73.11 |
| Median (50th) | $171,910 | $82.65 |
| 75th percentile | $191,880 | $92.25 |
| 90th percentile | $214,430 | $103.09 |

The job concentration index in District of Columbia nationwide is 6.27, suggesting that managers, all other are more concentrated here than the national average.
National Wage Comparison
Nationally, managers, all other earn a median of $95,684 per year ($46.00/hour), exceeding the District of Columbia median.
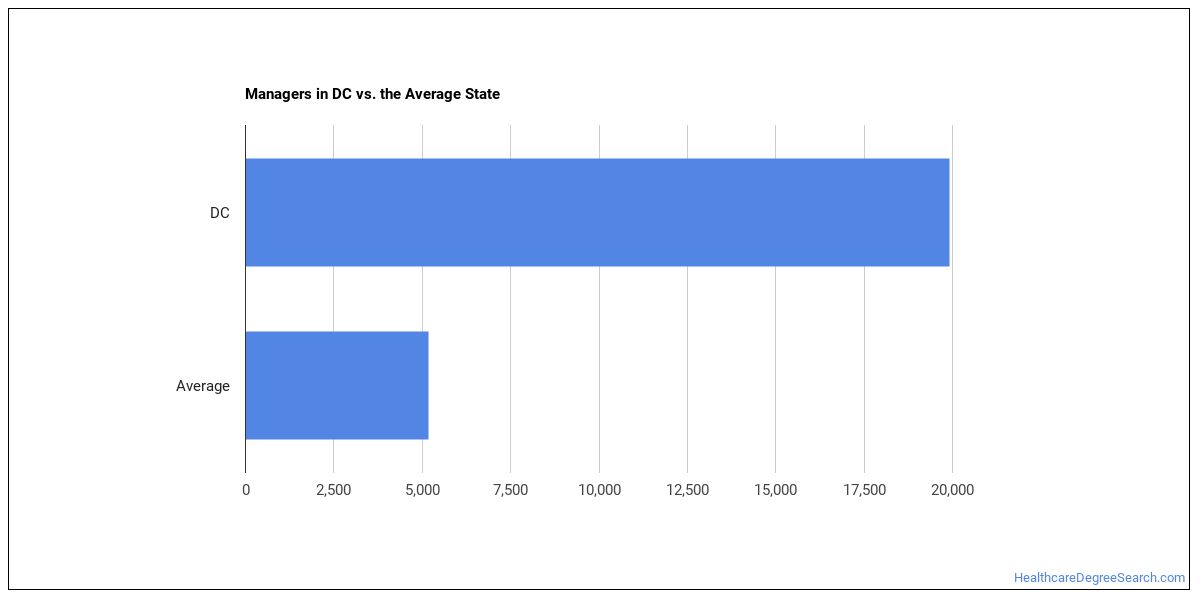
Employment Outlook
There are roughly 440,588 managers, all other nationwide. In District of Columbia alone, about 18,180 people work in this role. That’s higher than the typical state, which employs around 5,640 managers, all other.

Top District of Columbia Metros for Managers, All Other
The metro areas below employ the most managers, all other in District of Columbia.
| Metro Area | Number Employed | Annual Median Salary |
|---|---|---|
| Washington-Arlington-Alexandria, DC-VA-MD-WV | 42,870 | $167,270 |
Top States for Managers, All Other Employment
These states have the highest employment of managers, all other work.
| State | Number Employed |
|---|---|
| California | 103,510 |
| Texas | 53,070 |
| Florida | 46,500 |
| Georgia | 36,520 |
| Pennsylvania | 24,480 |
| New Jersey | 24,000 |
| Virginia | 22,210 |
| North Carolina | 21,150 |
| Maryland | 20,810 |
| District of Columbia | 18,180 |
| Tennessee | 17,260 |
| New York | 16,640 |
| Louisiana | 15,360 |
| Wisconsin | 13,910 |
| Colorado | 13,710 |
| Nevada | 10,990 |
| Washington | 10,740 |
| Massachusetts | 10,670 |
| Ohio | 9,390 |
| Arizona | 9,280 |
Highest-Paying States for Managers, All Other
These states pay the most for managers, all other.
| State | Annual Median Salary |
|---|---|
| Massachusetts | $172,380 |
| District of Columbia | $171,910 |
| California | $170,740 |
| Delaware | $170,310 |
| Washington | $165,080 |
| Colorado | $164,010 |
| New Jersey | $163,630 |
| Virginia | $162,610 |
| New York | $161,360 |
| Minnesota | $158,680 |
What Major Will Prepare You For This Career?
Programs that train for this career include:
- Pharmacy/Pharmaceutical Sciences
- Health/Medical Admin Services
Featured schools near , edit
Also Known As
Animal Ride Manager, Aquatic Facility Manager, Area Development Manager, Area Supervisor, Armored Transport Service Manager, Art Coordinator, Arts Administrator, Association Executive, Auto Repair Shop Manager, Barber or Beauty Shop Manager, Billiard Parlor Manager, Billing Manager, Board of Education Secretary, Body Shop Manager, Bowling Alley Manager.
References
- U.S. Bureau of Labor Statistics, Occupational Employment and Wage Statistics — https://www.bls.gov/oes/
- O*NET Online — https://www.onetonline.org/
- BLS Employment Projections — https://www.bls.gov/emp/
- O*NET-SOC code: 11-9199.00
HealthcareDegreeSearch.com provides higher-education, college and university, degree, program, career, salary, and other helpful information to students, faculty, institutions, and other internet audiences. Presented information and data are subject to change. Inclusion on this website does not imply or represent a direct relationship with the company, school, or brand. Information, though believed correct at time of publication, may not be correct, and no warranty is provided. Contact the schools to verify any information before relying on it. Financial aid may be available for those who qualify. The displayed options may include sponsored or recommended results, not necessarily based on your preferences.
© HealthcareDegreeSearch.com – All Rights Reserved.