Medical and Health Services Managers in Massachusetts
Want to work as a Medical and Health Services Managers in Massachusetts? Below are the key facts. Plan, direct, or coordinate medical and health services in hospitals, clinics, managed care organizations, public health agencies, or similar organizations.
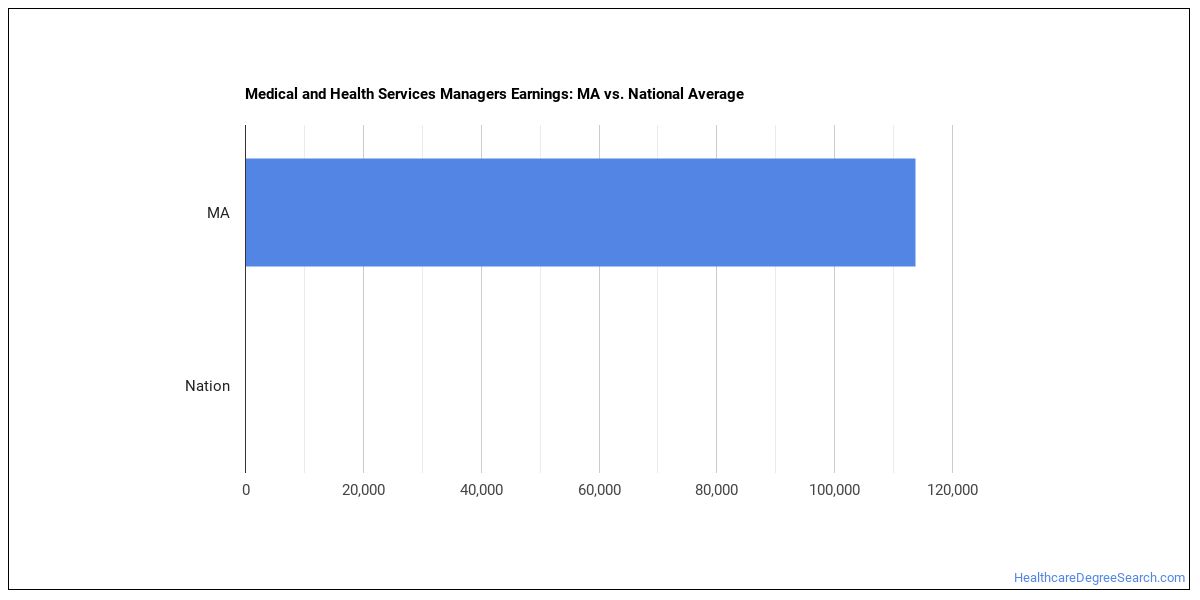
What do Medical and Health Services Managers Make in Massachusetts?
The medical and health services managers working in Massachusetts, wages run about $132,130 per year (or about $63.52/hour).
| Wage Statistic | Annual | Hourly |
|---|---|---|
| 10th percentile | $82,810 | $39.81 |
| 25th percentile | $101,320 | $48.71 |
| Median (50th) | $132,130 | $63.52 |
| 75th percentile | $178,650 | $85.89 |
| 90th percentile | n/a | n/a |

Location quotient — how concentrated this career is in Massachusetts relative to the national average — is 1.44, suggesting that medical and health services managers are more concentrated here than the national average.
National Wage Comparison
Nationally, medical and health services managers earn a median of $129,557 per year ($62.29/hour), exceeding the Massachusetts median.
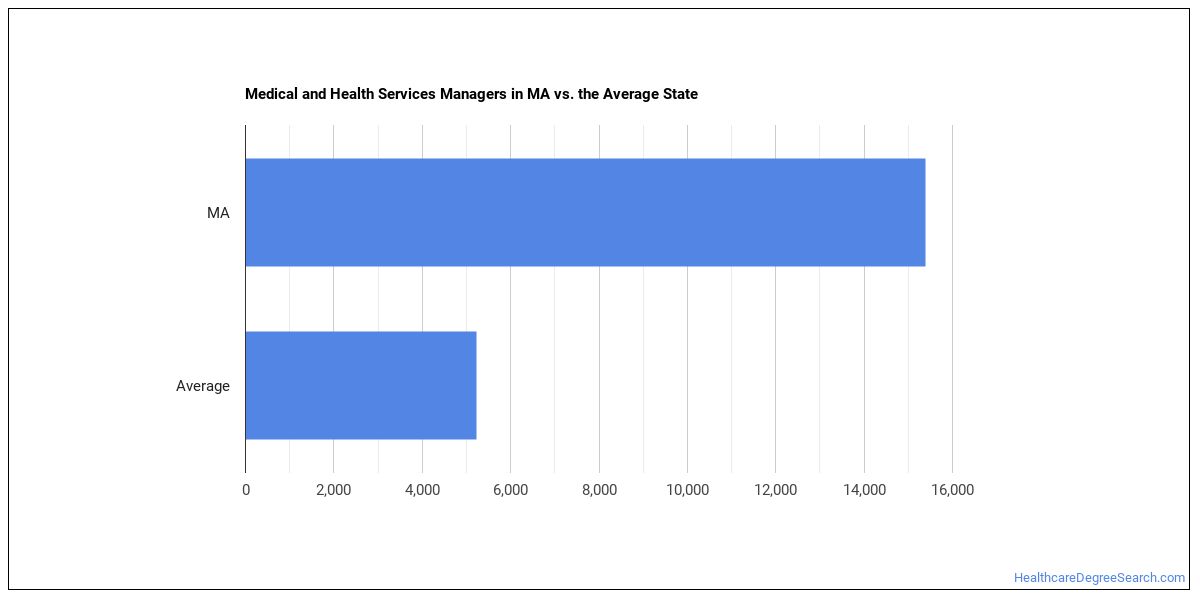
Employment Outlook
Nationally, total employment in this occupation is 385,544 medical and health services managers across the United States. In Massachusetts alone, around 19,190 people work in this role. That’s more than the typical state, which employs around 6,700 medical and health services managers.

Top Massachusetts Metros for Medical and Health Services Managers
These are the Massachusetts metros with the most medical and health services managers in Massachusetts.
| Metro Area | Number Employed | Annual Median Salary |
|---|---|---|
| Boston-Cambridge-Newton, MA-NH | 14,330 | $134,980 |
| Worcester, MA | 1,910 | $119,480 |
| Springfield, MA | 1,000 | $107,740 |
| Barnstable Town, MA | 430 | $115,120 |
| Pittsfield, MA | 300 | $125,780 |
| Amherst Town-Northampton, MA | 290 | $115,820 |
Top States for Medical and Health Services Managers Employment
The table below shows the states where the most medical and health services managers work.
| State | Number Employed |
|---|---|
| California | 68,800 |
| Texas | 57,150 |
| Florida | 40,550 |
| New York | 31,010 |
| Pennsylvania | 26,430 |
| Ohio | 23,280 |
| Illinois | 21,110 |
| Massachusetts | 19,190 |
| New Jersey | 16,070 |
| North Carolina | 15,860 |
| Maryland | 15,650 |
| Michigan | 14,890 |
| Tennessee | 13,470 |
| Indiana | 12,330 |
| Arizona | 11,410 |
| Minnesota | 10,130 |
| Virginia | 9,820 |
| Georgia | 9,610 |
| Alabama | 9,320 |
| Missouri | 9,100 |
Highest-Paying States for Medical and Health Services Managers
Where medical and health services managers earn the most: medical and health services managers.
| State | Annual Median Salary |
|---|---|
| District of Columbia | $161,050 |
| New York | $149,820 |
| Washington | $143,300 |
| Hawaii | $140,750 |
| California | $136,500 |
| Georgia | $136,030 |
| Oregon | $135,530 |
| Maryland | $132,590 |
| New Jersey | $132,250 |
| Massachusetts | $132,130 |
Skills
Top medical and health services managers skills, rated on an importance scale of 0 to 5:
Knowledge Areas
Key knowledge areas for this occupation, rated on an importance scale of 0 to 5:
Abilities
The abilities that matter most for medical and health services managers, rated on an importance scale of 0 to 5:
Daily Tasks
Day-to-day, medical and health services managers typically:
- Direct, supervise and evaluate work activities of medical, nursing, technical, clerical, service, maintenance, and other personnel.
- Develop and maintain computerized record management systems to store and process data, such as personnel activities and information, and to produce reports.
- Plan, implement, and administer programs and services in a health care or medical facility, including personnel administration, training, and coordination of medical, nursing and physical plant staff.
- Conduct and administer fiscal operations, including accounting, planning budgets, authorizing expenditures, establishing rates for services, and coordinating financial reporting.
- Maintain awareness of advances in medicine, computerized diagnostic and treatment equipment, data processing technology, government regulations, health insurance changes, and financing options.
- Establish work schedules and assignments for staff, according to workload, space, and equipment availability.
- Monitor the use of diagnostic services, inpatient beds, facilities, and staff to ensure effective use of resources and assess the need for additional staff, equipment, and services.
- Direct or conduct recruitment, hiring, and training of personnel.
- Manage change in integrated health care delivery systems, such as work restructuring, technological innovations, and shifts in the focus of care.
- Maintain communication between governing boards, medical staff, and department heads by attending board meetings and coordinating interdepartmental functioning.
- Establish objectives and evaluative or operational criteria for units managed.
- Develop and implement organizational policies and procedures for the facility or medical unit.
Work Activities
- Communicating with Supervisors, Peers, or Subordinates
- Working with Computers
- Evaluating Information to Determine Compliance with Standards
- Coaching and Developing Others
- Getting Information
- Establishing and Maintaining Interpersonal Relationships
- Making Decisions and Solving Problems
- Analyzing Data or Information
- Updating and Using Relevant Knowledge
- Coordinating the Work and Activities of Others
- Processing Information
- Organizing, Planning, and Prioritizing Work
Tools & Technology
Common tools and software used in this occupation include: Hot technologies: Adobe Acrobat, Apache Hadoop, Apache Maven, Autodesk Revit, Cisco Webex In-demand technologies: Microsoft Excel
What Major Will Prepare You For This Career?
Several college majors map to this occupation:
- Health/Medical Admin Services
- Public Health
- Nursing
- Pharmacy/Pharmaceutical Sciences
- Bioethics/Medical Ethics
Featured schools near , edit
Related Careers
Careers similar to medical and health services managers include:
- Education and Childcare Administrators, Preschool and Daycare
- Clinical Research Coordinators
- Social and Community Service Managers
- Management Analysts
- Health Informatics Specialists
- Clinical Data Managers
Also Known As
Assisted Living Administrator, Assisted Living Manager, Cancer Center Director, Care Coordinator, Client Services Director, Clinic Director, Clinical Director, Clinical Informatics Director, Clinical Manager, Clinical Services Director, Clinical Supervisor, Community Health Nursing Director, Correctional Therapy Director, Dental Laboratory Manager (Dental Lab Manager), EMS Coordinator (Emergency Medical Services Coordinator).
References
- U.S. Bureau of Labor Statistics, Occupational Employment and Wage Statistics — https://www.bls.gov/oes/
- O*NET Online — https://www.onetonline.org/
- BLS Employment Projections — https://www.bls.gov/emp/
- O*NET-SOC code: 11-9111.00
HealthcareDegreeSearch.com provides higher-education, college and university, degree, program, career, salary, and other helpful information to students, faculty, institutions, and other internet audiences. Presented information and data are subject to change. Inclusion on this website does not imply or represent a direct relationship with the company, school, or brand. Information, though believed correct at time of publication, may not be correct, and no warranty is provided. Contact the schools to verify any information before relying on it. Financial aid may be available for those who qualify. The displayed options may include sponsored or recommended results, not necessarily based on your preferences.
© HealthcareDegreeSearch.com – All Rights Reserved.