Nurse Practitioners in Virginia
Thinking about a career as a Nurse Practitioners in Virginia? Here’s what the data says. Diagnose and treat acute, episodic, or chronic illness, independently or as part of a healthcare team. May focus on health promotion and disease prevention. May order, perform, or interpret diagnostic tests such as lab work and x rays. May prescribe medication. Must be registered nurses who have specialized graduate education.
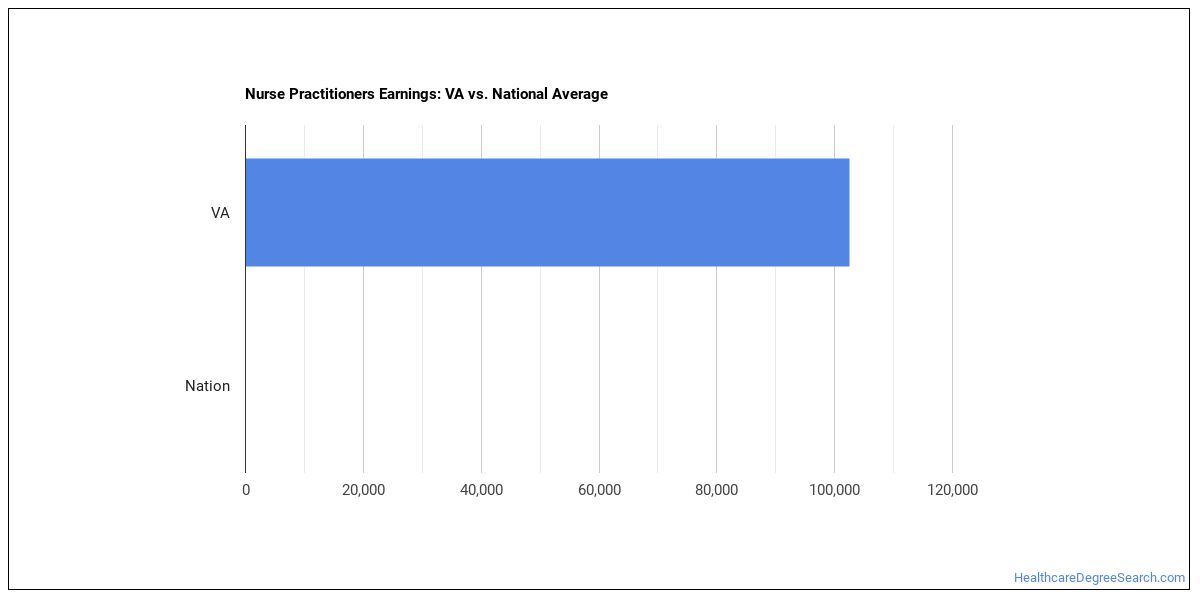
What do Nurse Practitioners Make in Virginia?
The nurse practitioners working in Virginia, the median annual wage is $124,210 per year (or about $59.72/hour).Earnings range from $85,020 at the 10th percentile to $155,800 at the 90th percentile.
| Wage Statistic | Annual | Hourly |
|---|---|---|
| 10th percentile | $85,020 | $40.87 |
| 25th percentile | $106,690 | $51.29 |
| Median (50th) | $124,210 | $59.72 |
| 75th percentile | $132,940 | $63.91 |
| 90th percentile | $155,800 | $74.90 |

The location quotient — a measure of how concentrated this occupation is in Virginia compared to the national average — is 0.80, indicating fewer nurse practitioners per worker than the national average.
National Wage Comparison
Nationally, nurse practitioners earn a median of $147,651 per year ($70.99/hour), below the Virginia median.
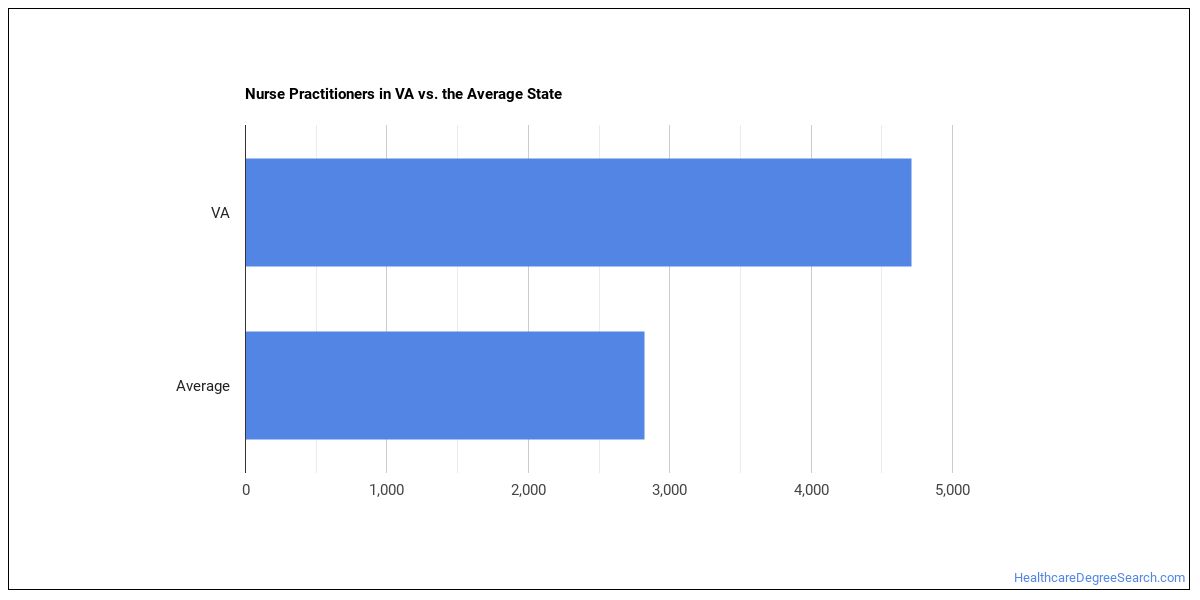
Employment Outlook
There are roughly 1,967,669 nurse practitioners nationwide. In Virginia alone, around 6,470 people work in this role. That’s more than the typical state, which employs around 4,170 nurse practitioners.

Top Virginia Metros for Nurse Practitioners
The largest metro-area employers of nurse practitioners in Virginia.
| Metro Area | Number Employed | Annual Median Salary |
|---|---|---|
| Virginia Beach-Chesapeake-Norfolk, VA-NC | 1,290 | $125,330 |
| Richmond, VA | 1,100 | $124,990 |
| Charlottesville, VA | 450 | $129,260 |
| Roanoke, VA | 250 | $122,030 |
| Lynchburg, VA | 220 | $108,260 |
| Winchester, VA-WV | 160 | $126,540 |
| Blacksburg-Christiansburg-Radford, VA | 120 | $124,660 |
| Harrisonburg, VA | 90 | $110,510 |
| Staunton-Stuarts Draft, VA | 90 | $124,090 |
Top States for Nurse Practitioners Employment
View the states that employ the most nurse practitioners work.
| State | Number Employed |
|---|---|
| Florida | 24,690 |
| Texas | 21,690 |
| California | 20,980 |
| New York | 20,430 |
| Ohio | 14,550 |
| Tennessee | 14,300 |
| Pennsylvania | 10,860 |
| Georgia | 10,580 |
| New Jersey | 9,590 |
| Illinois | 9,560 |
| Massachusetts | 8,920 |
| Minnesota | 8,690 |
| North Carolina | 8,020 |
| Michigan | 7,900 |
| Arizona | 7,540 |
| Indiana | 7,470 |
| Missouri | 6,820 |
| Maryland | 6,640 |
| Virginia | 6,470 |
| South Carolina | 5,850 |
Highest-Paying States for Nurse Practitioners
Where nurse practitioners earn the most: nurse practitioners.
| State | Annual Median Salary |
|---|---|
| California | $166,610 |
| New Jersey | $149,620 |
| Alaska | $145,450 |
| New York | $145,390 |
| Oregon | $144,600 |
| Washington | $140,220 |
| Connecticut | $138,960 |
| Massachusetts | $138,890 |
| New Mexico | $138,440 |
| Arizona | $133,790 |
Skills
Top nurse practitioners skills, rated on an importance scale of 0 to 5:
Knowledge Areas
Core knowledge areas for this occupation, rated on an importance scale of 0 to 5:
Abilities
Key abilities for nurse practitioners, rated on an importance scale of 0 to 5:
Daily Tasks
Day-to-day, nurse practitioners typically:
- Maintain complete and detailed records of patients' health care plans and prognoses.
- Develop treatment plans, based on scientific rationale, standards of care, and professional practice guidelines.
- Provide patients with information needed to promote health, reduce risk factors, or prevent disease or disability.
- Analyze and interpret patients' histories, symptoms, physical findings, or diagnostic information to develop appropriate diagnoses.
- Diagnose or treat complex, unstable, comorbid, episodic, or emergency conditions in collaboration with other health care providers as necessary.
- Prescribe medication dosages, routes, and frequencies, based on such patient characteristics as age and gender.
- Diagnose or treat chronic health care problems, such as high blood pressure and diabetes.
- Prescribe medications based on efficacy, safety, and cost as legally authorized.
- Recommend diagnostic or therapeutic interventions with attention to safety, cost, invasiveness, simplicity, acceptability, adherence, and efficacy.
- Detect and respond to adverse drug reactions, with special attention to vulnerable populations such as infants, children, pregnant and lactating women, or older adults.
- Diagnose or treat acute health care problems, such as illnesses, infections, or injuries.
- Counsel patients about drug regimens and possible side effects or interactions with other substances, such as food supplements, over-the-counter (OTC) medications, or herbal remedies.
Work Activities
- Documenting/Recording Information
- Making Decisions and Solving Problems
- Getting Information
- Assisting and Caring for Others
- Updating and Using Relevant Knowledge
- Identifying Objects, Actions, and Events
- Establishing and Maintaining Interpersonal Relationships
- Analyzing Data or Information
- Processing Information
- Interpreting the Meaning of Information for Others
- Working with Computers
- Communicating with Supervisors, Peers, or Subordinates
Tools & Technology
Software and systems commonly involved: Hot technologies: eClinicalWorks EHR software, Epic Systems
What Major Will Prepare You For This Career?
Related college programs include:
Related Careers
Other careers like nurse practitioners include:
- Physician Assistants
- Registered Nurses
- Acute Care Nurses
- Advanced Practice Psychiatric Nurses
- Critical Care Nurses
- Clinical Nurse Specialists
Also Known As
ACNP (Acute Care Nurse Practitioner), ARNP Specialist (Advanced Registered Nurse Practitioner Specialist), Adult Nurse Practitioner, Advanced Practice Nurse (APN), Advanced Practice Provider, Advanced Practice Registered Nurse (APRN), CPNP (Certified Pediatric Nurse Practitioner), Cardiology Nurse Practitioner, Certified Nurse Practitioner, Certified Registered Nurse Practitioner, Dermatology Nurse Practitioner, Electrophysiology Nurse Practitioner, Emergency Medicine Nurse Practitioner, FNP (Family Medicine Nurse Practitioner), FNP (Family Practice Nurse Practitioner).
References
- U.S. Bureau of Labor Statistics, Occupational Employment and Wage Statistics — https://www.bls.gov/oes/
- O*NET Online — https://www.onetonline.org/
- BLS Employment Projections — https://www.bls.gov/emp/
- O*NET-SOC code: 29-1171.00
HealthcareDegreeSearch.com provides higher-education, college and university, degree, program, career, salary, and other helpful information to students, faculty, institutions, and other internet audiences. Presented information and data are subject to change. Inclusion on this website does not imply or represent a direct relationship with the company, school, or brand. Information, though believed correct at time of publication, may not be correct, and no warranty is provided. Contact the schools to verify any information before relying on it. Financial aid may be available for those who qualify. The displayed options may include sponsored or recommended results, not necessarily based on your preferences.
© HealthcareDegreeSearch.com – All Rights Reserved.