Pharmacists in Illinois
Thinking about a career as a Pharmacists in Illinois? Below are the key facts. Dispense drugs prescribed by physicians and other health practitioners and provide information to patients about medications and their use. May advise physicians and other health practitioners on the selection, dosage, interactions, and side effects of medications.
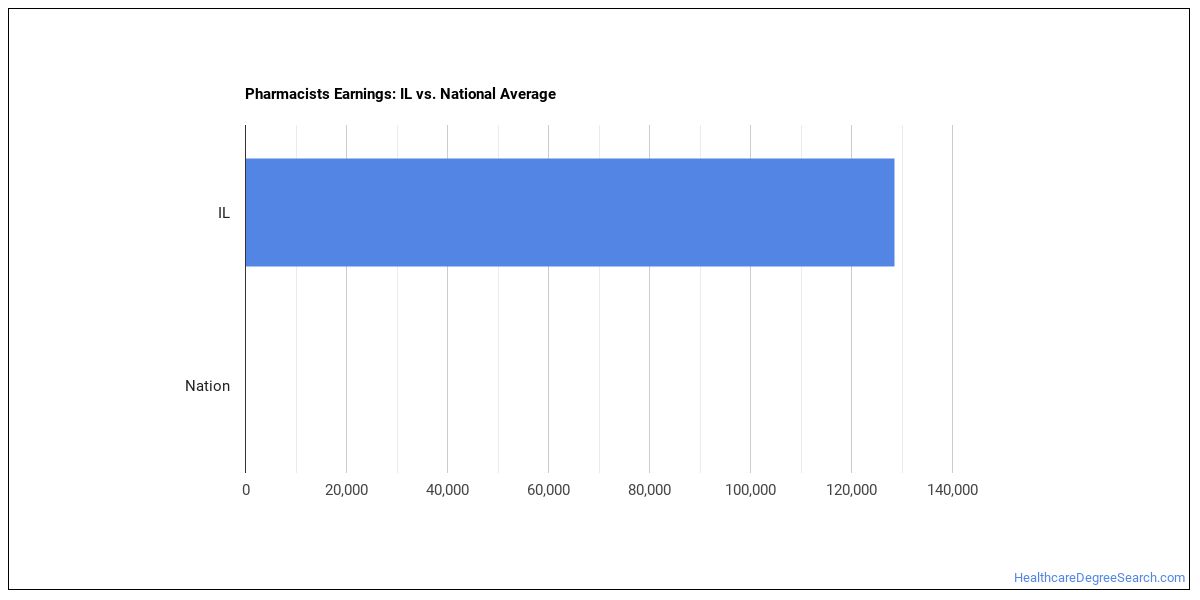
What do Pharmacists Make in Illinois?
For a pharmacists working in Illinois, the typical annual salary is $135,880 per year (or about $65.33/hour).Annual wages span from $99,610 at the 10th percentile to $166,090 at the 90th percentile.
| Wage Statistic | Annual | Hourly |
|---|---|---|
| 10th percentile | $99,610 | $47.89 |
| 25th percentile | $129,630 | $62.32 |
| Median (50th) | $135,880 | $65.33 |
| 75th percentile | $156,410 | $75.20 |
| 90th percentile | $166,090 | $79.85 |

The job concentration index in Illinois relative to the national average — is 0.96.
National Wage Comparison
Nationally, pharmacists earn a median of $93,686 per year ($45.04/hour), above the Illinois median.
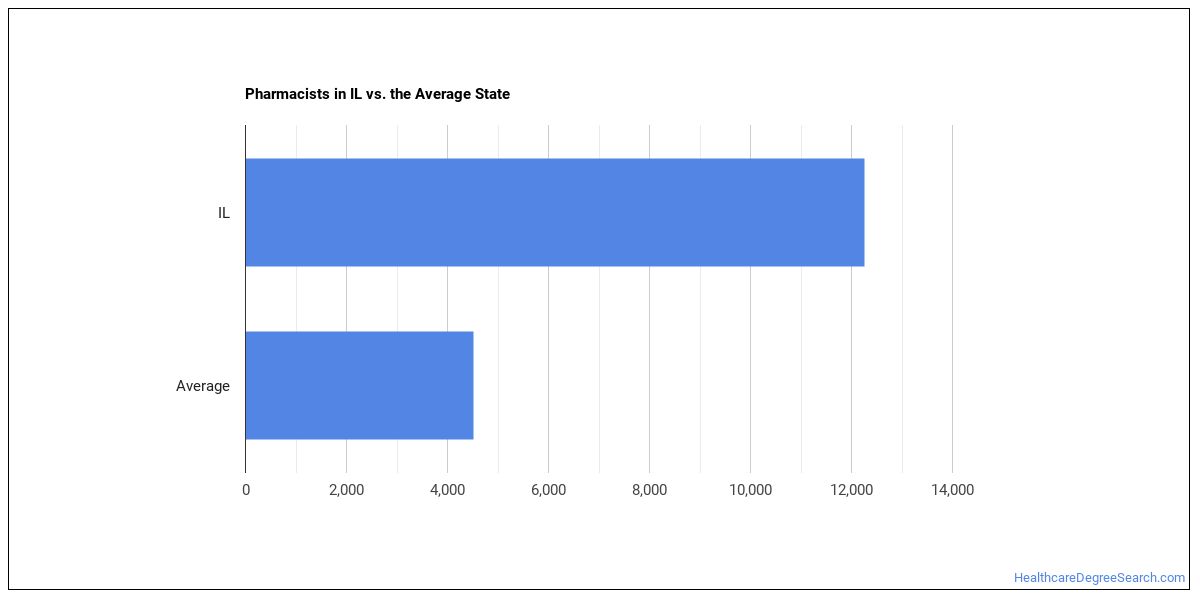
Employment Outlook
Nationally, total employment in this occupation is 990,178 pharmacists across the United States. In Illinois alone, about 12,450 people work in this role. That puts the state above the typical state, which employs around 3,870 pharmacists.

Top Illinois Metros for Pharmacists
These are the Illinois metros with the most pharmacists in Illinois.
| Metro Area | Number Employed | Annual Median Salary |
|---|---|---|
| Chicago-Naperville-Elgin, IL-IN | 9,630 | $137,610 |
| Peoria, IL | 320 | $136,340 |
| Springfield, IL | 290 | $135,060 |
| Rockford, IL | 260 | $139,570 |
| Champaign-Urbana, IL | 220 | $134,830 |
| Bloomington, IL | 100 | $133,160 |
| Kankakee, IL | 90 | $134,910 |
| Decatur, IL | 80 | $139,370 |
Top States for Pharmacists Employment
These states have the highest employment of pharmacists work.
| State | Number Employed |
|---|---|
| California | 34,490 |
| Texas | 22,720 |
| New York | 21,330 |
| Florida | 20,270 |
| Pennsylvania | 15,120 |
| Ohio | 13,700 |
| Illinois | 12,450 |
| Georgia | 11,480 |
| North Carolina | 11,440 |
| New Jersey | 10,930 |
| Michigan | 9,640 |
| Tennessee | 8,050 |
| Massachusetts | 7,950 |
| Washington | 7,940 |
| Virginia | 7,700 |
| Arizona | 7,690 |
| Missouri | 7,070 |
| Indiana | 6,200 |
| Minnesota | 6,010 |
| South Carolina | 5,920 |
Highest-Paying States for Pharmacists
The highest-paying states for pharmacists.
| State | Annual Median Salary |
|---|---|
| California | $165,150 |
| Alaska | $163,200 |
| Oregon | $163,120 |
| Washington | $157,020 |
| Minnesota | $154,610 |
| Colorado | $151,680 |
| Hawaii | $150,710 |
| District of Columbia | $141,560 |
| New Hampshire | $141,480 |
| Delaware | $140,470 |
Skills
Top pharmacists skills, rated on an importance scale of 0 to 5:
Knowledge Areas
Key knowledge areas for this occupation, rated on an importance scale of 0 to 5:
Abilities
The abilities that matter most for pharmacists, rated on an importance scale of 0 to 5:
Daily Tasks
Common tasks include:
- Review prescriptions to assure accuracy, to ascertain the needed ingredients, and to evaluate their suitability.
- Assess the identity, strength, or purity of medications.
- Provide information and advice regarding drug interactions, side effects, dosage, and proper medication storage.
- Analyze prescribing trends to monitor patient compliance and to prevent excessive usage or harmful interactions.
- Maintain records, such as pharmacy files, patient profiles, charge system files, inventories, control records for radioactive nuclei, or registries of poisons, narcotics, or controlled drugs.
- Collaborate with other health care professionals to plan, monitor, review, or evaluate the quality or effectiveness of drugs or drug regimens, providing advice on drug applications or characteristics.
- Plan, implement, or maintain procedures for mixing, packaging, or labeling pharmaceuticals, according to policy and legal requirements, to ensure quality, security, and proper disposal.
- Order and purchase pharmaceutical supplies, medical supplies, or drugs, maintaining stock and storing and handling it properly.
- Compound and dispense medications as prescribed by doctors and dentists, by calculating, weighing, measuring, and mixing ingredients, or oversee these activities.
- Contact insurance companies to resolve billing issues.
- Advise customers on the selection of medication brands, medical equipment, or healthcare supplies.
- Teach pharmacy students serving as interns in preparation for their graduation or licensure.
Work Activities
- Documenting/Recording Information
- Updating and Using Relevant Knowledge
- Evaluating Information to Determine Compliance with Standards
- Making Decisions and Solving Problems
- Getting Information
- Working with Computers
- Processing Information
- Monitoring Processes, Materials, or Surroundings
- Interpreting the Meaning of Information for Others
- Communicating with Supervisors, Peers, or Subordinates
- Organizing, Planning, and Prioritizing Work
- Identifying Objects, Actions, and Events
Tools & Technology
Technologies frequently used: Hot technologies: eClinicalWorks EHR software, Epic Systems
What Major Will Prepare You For This Career?
Related college programs include:
- Pharmacy/Pharmaceutical Sciences
Featured schools near , edit
Related Careers
Careers similar to pharmacists include:
- Physician Assistants
- Anesthesiologist Assistants
- Registered Nurses
- Acute Care Nurses
- Clinical Nurse Specialists
- Nurse Anesthetists
Also Known As
Apothecary, Clinical Pharmacist, District Pharmacy Supervisor, Druggist, Float Pharmacist, Hospital Pharmacist, Industrial Pharmacist, Informatics Pharmacist, Outpatient Pharmacist, Pharm D (Pharmacy Doctor), Pharmacist, Pharmacist in Charge (PIC), Pharmacy Consultant, Pharmacy Coordinator, Pharmacy Informaticist.
References
- U.S. Bureau of Labor Statistics, Occupational Employment and Wage Statistics — https://www.bls.gov/oes/
- O*NET Online — https://www.onetonline.org/
- BLS Employment Projections — https://www.bls.gov/emp/
- O*NET-SOC code: 29-1051.00
HealthcareDegreeSearch.com provides higher-education, college and university, degree, program, career, salary, and other helpful information to students, faculty, institutions, and other internet audiences. Presented information and data are subject to change. Inclusion on this website does not imply or represent a direct relationship with the company, school, or brand. Information, though believed correct at time of publication, may not be correct, and no warranty is provided. Contact the schools to verify any information before relying on it. Financial aid may be available for those who qualify. The displayed options may include sponsored or recommended results, not necessarily based on your preferences.
© HealthcareDegreeSearch.com – All Rights Reserved.