Pharmacy Technicians in Oregon
Considering working as a Pharmacy Technicians in Oregon? Below are the key facts. Prepare medications under the direction of a pharmacist. May measure, mix, count out, label, and record amounts and dosages of medications according to prescription orders.
What do Pharmacy Technicians Make in Oregon?
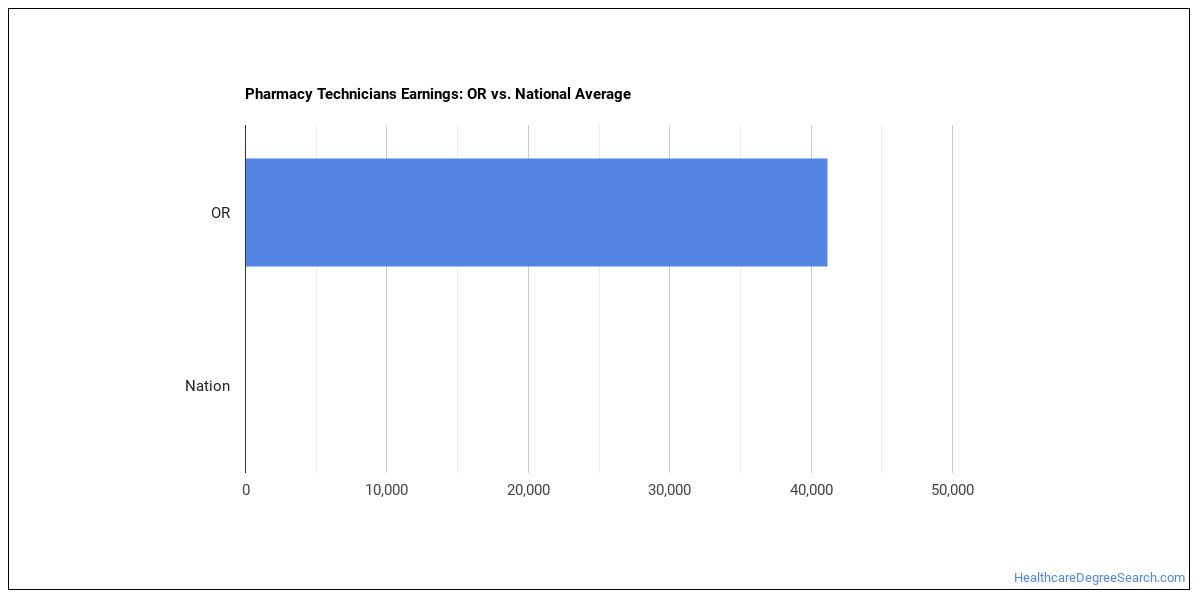
The pharmacy technicians working in Oregon, the median annual wage is $51,210 per year (or roughly $24.62/hour).Pay can range from $42,940 at the 10th percentile to $65,320 at the 90th percentile.
| Wage Statistic | Annual | Hourly |
|---|---|---|
| 10th percentile | $42,940 | $20.64 |
| 25th percentile | $47,020 | $22.61 |
| Median (50th) | $51,210 | $24.62 |
| 75th percentile | $61,020 | $29.34 |
| 90th percentile | $65,320 | $31.40 |

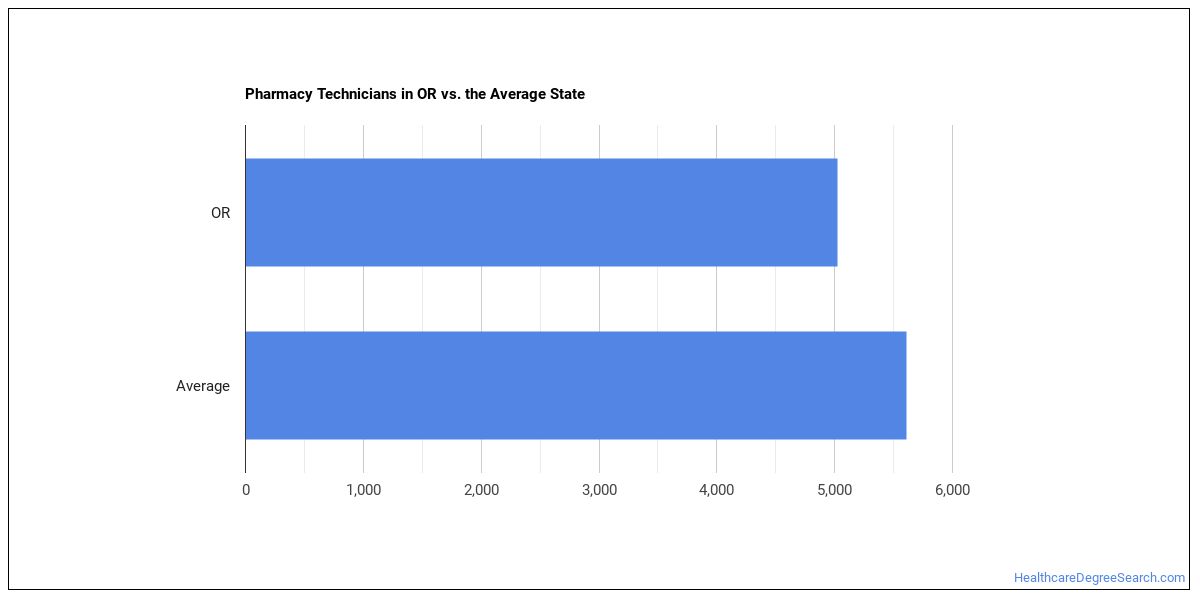
Location quotient — how concentrated this career is in Oregon nationwide is 0.73, meaning fewer pharmacy technicians per worker than the national average.
National Wage Comparison
Nationally, pharmacy technicians earn a median of $72,773 per year ($34.99/hour), lower than the Oregon median.
Employment Outlook
There are roughly 2,505,396 pharmacy technicians nationwide. In Oregon alone, approximately 4,570 people work in this role. That’s fewer than the typical state, which employs around 6,030 pharmacy technicians.

Top Oregon Metros for Pharmacy Technicians
The metro areas below employ the most pharmacy technicians in Oregon.
| Metro Area | Number Employed | Annual Median Salary |
|---|---|---|
| Portland-Vancouver-Hillsboro, OR-WA | 2,740 | $54,740 |
| Eugene-Springfield, OR | 510 | $49,080 |
| Salem, OR | 390 | $50,600 |
| Medford, OR | 270 | $53,280 |
| Bend, OR | 210 | $53,080 |
| Albany, OR | 110 | $49,270 |
| Corvallis, OR | 100 | $46,900 |
| Grants Pass, OR | 90 | $49,920 |
Top States for Pharmacy Technicians Employment
These states have the highest employment of pharmacy technicians work.
| State | Number Employed |
|---|---|
| California | 45,210 |
| Texas | 41,610 |
| Florida | 38,950 |
| New York | 26,450 |
| Illinois | 22,790 |
| Ohio | 20,100 |
| Pennsylvania | 19,630 |
| North Carolina | 16,600 |
| Georgia | 15,780 |
| Michigan | 14,610 |
| New Jersey | 14,130 |
| Tennessee | 12,350 |
| Massachusetts | 11,980 |
| Missouri | 11,420 |
| Virginia | 11,260 |
| Arizona | 11,260 |
| Indiana | 11,040 |
| Kentucky | 10,040 |
| Washington | 9,260 |
| Wisconsin | 8,840 |
Highest-Paying States for Pharmacy Technicians
These states pay the most for pharmacy technicians.
| State | Annual Median Salary |
|---|---|
| Washington | $56,140 |
| Oregon | $51,210 |
| Alaska | $50,440 |
| California | $49,640 |
| Minnesota | $48,560 |
| Colorado | $48,070 |
| Arizona | $47,620 |
| North Dakota | $47,600 |
| Montana | $46,980 |
| Utah | $46,760 |
Skills
Top pharmacy technicians skills, rated on an importance scale of 0 to 5:
Knowledge Areas
Core knowledge areas for this occupation, rated on an importance scale of 0 to 5:
Abilities
Key abilities for pharmacy technicians, rated on an importance scale of 0 to 5:
Daily Tasks
Day-to-day, pharmacy technicians typically:
- Receive written prescription or refill requests and verify that information is complete and accurate.
- Enter prescription information into computer databases.
- Establish or maintain patient profiles, including lists of medications taken by individual patients.
- Maintain proper storage and security conditions for drugs.
- Receive and store incoming supplies, verify quantities against invoices, check for outdated medications in current inventory, and inform supervisors of stock needs and shortages.
- Answer telephones, responding to questions or requests.
- Assist customers by answering simple questions, locating items, or referring them to the pharmacist for medication information.
- Operate cash registers to accept payment from customers.
- Price and file prescriptions that have been filled.
- Mix pharmaceutical preparations, according to written prescriptions.
- Order, label, and count stock of medications, chemicals, or supplies and enter inventory data into computer.
- Clean and help maintain equipment or work areas and sterilize glassware, according to prescribed methods.
Work Activities
- Getting Information
- Working with Computers
- Evaluating Information to Determine Compliance with Standards
- Processing Information
- Documenting/Recording Information
- Establishing and Maintaining Interpersonal Relationships
- Performing for or Working Directly with the Public
- Monitoring Processes, Materials, or Surroundings
- Communicating with Supervisors, Peers, or Subordinates
- Identifying Objects, Actions, and Events
- Updating and Using Relevant Knowledge
- Training and Teaching Others
Tools & Technology
Technologies frequently used: Hot technologies: Apple Safari, MEDITECH software In-demand technologies: Microsoft Excel
What Major Will Prepare You For This Career?
Related college programs include:
- Allied Health Services
Featured schools near , edit
Related Careers
Other careers like pharmacy technicians include:
- Medical and Health Services Managers
- Pharmacists
- Anesthesiologist Assistants
- Medical and Clinical Laboratory Technologists
- Medical and Clinical Laboratory Technicians
- Cardiovascular Technologists and Technicians
Also Known As
Accredited Pharmacy Technician, Certified Pharmacy Technician (CPhT), Chemotherapy Pharmacy Technician (Chemo Pharmacy Technician), Compounding Pharmacy Tech (Compounding Pharmacy Technician), Compounding Technician, Drug Coordinator, Hospital Pharmacy Tech (Hospital Pharmacy Technician), Inpatient Pharmacy Tech (Inpatient Pharmacy Technician), OR Pharmacy Tech (Operating Room Pharmacy Tech), Pharmacist Assistant, Pharmacist Technician, Pharmacy Clerk, Pharmacy Laboratory Technician, Pharmacy Service Associate, Pharmacy Technician (Pharm Tech).
References
- U.S. Bureau of Labor Statistics, Occupational Employment and Wage Statistics — https://www.bls.gov/oes/
- O*NET Online — https://www.onetonline.org/
- BLS Employment Projections — https://www.bls.gov/emp/
- O*NET-SOC code: 29-2052.00
HealthcareDegreeSearch.com provides higher-education, college and university, degree, program, career, salary, and other helpful information to students, faculty, institutions, and other internet audiences. Presented information and data are subject to change. Inclusion on this website does not imply or represent a direct relationship with the company, school, or brand. Information, though believed correct at time of publication, may not be correct, and no warranty is provided. Contact the schools to verify any information before relying on it. Financial aid may be available for those who qualify. The displayed options may include sponsored or recommended results, not necessarily based on your preferences.
© HealthcareDegreeSearch.com – All Rights Reserved.