Phlebotomists in Oregon
Considering working as a Phlebotomists in Oregon? Here’s what you need to know. Draw blood for tests, transfusions, donations, or research. May explain the procedure to patients and assist in the recovery of patients with adverse reactions.
What do Phlebotomists Make in Oregon?
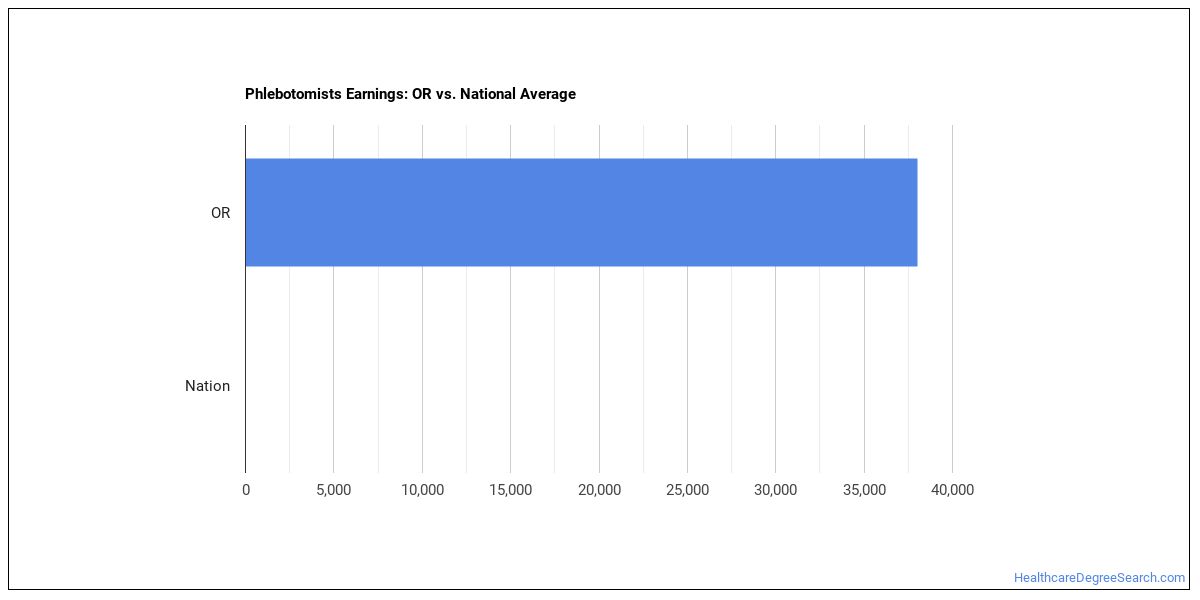
The phlebotomists working in Oregon, wages run about $47,510 per year (or about $22.84/hour).Earnings range from $38,900 at the 10th percentile to $60,870 at the 90th percentile.
| Wage Statistic | Annual | Hourly |
|---|---|---|
| 10th percentile | $38,900 | $18.70 |
| 25th percentile | $42,570 | $20.47 |
| Median (50th) | $47,510 | $22.84 |
| 75th percentile | $55,080 | $26.48 |
| 90th percentile | $60,870 | $29.27 |

Location quotient — how concentrated this career is in Oregon compared to the national average — is 1.10.
National Wage Comparison
Nationally, phlebotomists earn a median of $28,271 per year ($13.59/hour), higher than the Oregon median.
Employment Outlook
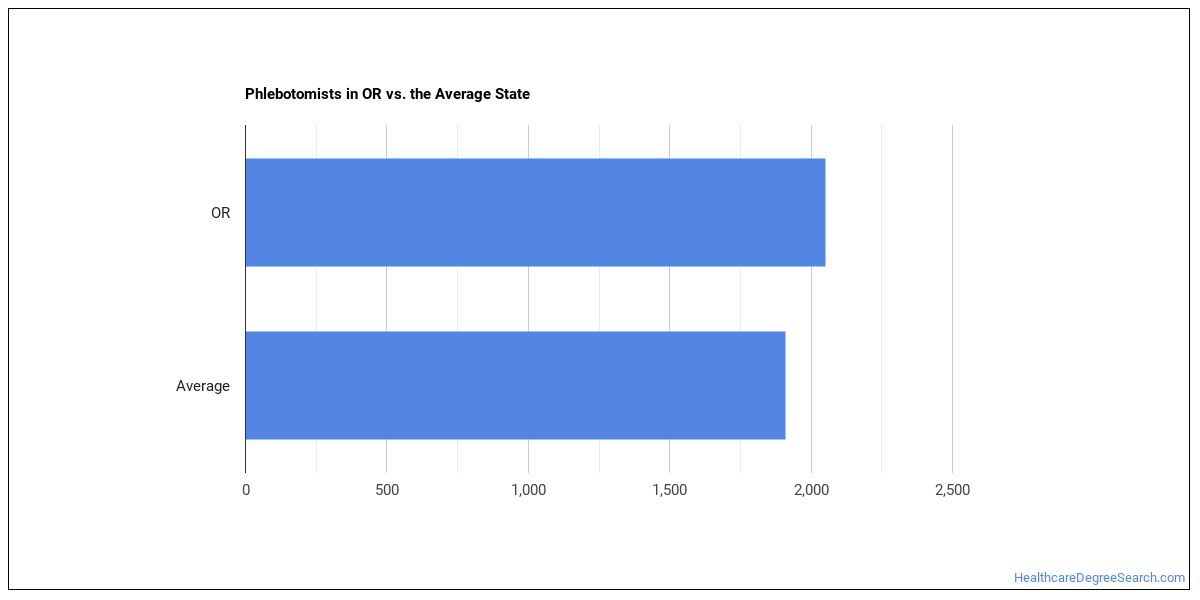
National employment for 1,451,053 phlebotomists nationwide. In Oregon alone, about 1,950 people work in this role. That’s below the typical state, which employs around 2,030 phlebotomists.

Top Oregon Metros for Phlebotomists
These are the Oregon metros with the most phlebotomists in Oregon.
| Metro Area | Number Employed | Annual Median Salary |
|---|---|---|
| Portland-Vancouver-Hillsboro, OR-WA | 1,100 | $48,760 |
| Eugene-Springfield, OR | 190 | $45,300 |
| Salem, OR | 160 | $46,800 |
| Medford, OR | 130 | $44,810 |
| Bend, OR | 100 | $48,280 |
| Grants Pass, OR | 60 | n/a |
Top States for Phlebotomists Employment
These states have the highest employment of phlebotomists work.
| State | Number Employed |
|---|---|
| Texas | 13,410 |
| California | 13,150 |
| Florida | 9,760 |
| Illinois | 7,640 |
| Georgia | 5,470 |
| New York | 5,190 |
| Pennsylvania | 5,140 |
| North Carolina | 5,120 |
| Ohio | 4,640 |
| New Jersey | 4,160 |
| Wisconsin | 3,820 |
| Arizona | 3,660 |
| Virginia | 3,300 |
| Michigan | 3,070 |
| Tennessee | 3,000 |
| Louisiana | 2,940 |
| South Carolina | 2,880 |
| Massachusetts | 2,790 |
| Alabama | 2,510 |
| Kentucky | 2,490 |
Highest-Paying States for Phlebotomists
Where phlebotomists earn the most: phlebotomists.
| State | Annual Median Salary |
|---|---|
| California | $55,460 |
| New York | $49,080 |
| Massachusetts | $48,270 |
| Washington | $47,700 |
| Rhode Island | $47,650 |
| Oregon | $47,510 |
| District of Columbia | $47,110 |
| Maryland | $47,100 |
| Colorado | $47,020 |
| New Jersey | $46,840 |
Skills
The most important phlebotomists skills, rated on an importance scale of 0 to 5:
Knowledge Areas
Important knowledge areas for this occupation, rated on an importance scale of 0 to 5:
Abilities
The abilities that matter most for phlebotomists, rated on an importance scale of 0 to 5:
Daily Tasks
Phlebotomists typically:
- Dispose of contaminated sharps, in accordance with applicable laws, standards, and policies.
- Organize or clean blood-drawing trays, ensuring that all instruments are sterile and all needles, syringes, or related items are of first-time use.
- Draw blood from veins by vacuum tube, syringe, or butterfly venipuncture methods.
- Match laboratory requisition forms to specimen tubes.
- Dispose of blood or other biohazard fluids or tissue, in accordance with applicable laws, standards, or policies.
- Conduct standards tests, such as blood alcohol, blood culture, oral glucose tolerance, glucose screening, blood smears, or peak and trough drug levels tests.
- Collect specimens at specific time intervals for tests, such as those assessing therapeutic drug levels.
- Process blood or other fluid samples for further analysis by other medical professionals.
- Provide sample analysis results to physicians to assist diagnosis.
- Enter patient, specimen, insurance, or billing information into computer.
- Document route of specimens from collection to laboratory analysis and diagnosis.
- Draw blood from capillaries by dermal puncture, such as heel or finger stick methods.
Work Activities
- Assisting and Caring for Others
- Getting Information
- Communicating with Supervisors, Peers, or Subordinates
- Working with Computers
- Updating and Using Relevant Knowledge
- Processing Information
- Making Decisions and Solving Problems
- Evaluating Information to Determine Compliance with Standards
- Documenting/Recording Information
- Organizing, Planning, and Prioritizing Work
- Performing for or Working Directly with the Public
- Establishing and Maintaining Interpersonal Relationships
Tools & Technology
Technologies frequently used: Hot technologies: JavaScript In-demand technologies: Microsoft Office software
What Major Will Prepare You For This Career?
Related college programs include:
- Clinical/Medical Laboratory Science
Featured schools near , edit
Related Careers
Other careers like phlebotomists include:
- Nurse Anesthetists
- Medical and Clinical Laboratory Technologists
- Cytotechnologists
- Histotechnologists
- Medical and Clinical Laboratory Technicians
- Histology Technicians
Also Known As
Certified Phlebotomist, Certified Phlebotomy Technician, Clinical Phlebotomist, Collections Technician, Lab Liaison Technician, Laboratory Phlebotomist, Long Term Care Phlebotomist, Mobile Examiner, Mobile Phlebotomist, Outpatient Phlebotomist, Patient Service Technician (PST), Phlebotomist, Phlebotomy Services Representative, Phlebotomy Services Technician, Phlebotomy Technician.
References
- U.S. Bureau of Labor Statistics, Occupational Employment and Wage Statistics — https://www.bls.gov/oes/
- O*NET Online — https://www.onetonline.org/
- BLS Employment Projections — https://www.bls.gov/emp/
- O*NET-SOC code: 31-9097.00
HealthcareDegreeSearch.com provides higher-education, college and university, degree, program, career, salary, and other helpful information to students, faculty, institutions, and other internet audiences. Presented information and data are subject to change. Inclusion on this website does not imply or represent a direct relationship with the company, school, or brand. Information, though believed correct at time of publication, may not be correct, and no warranty is provided. Contact the schools to verify any information before relying on it. Financial aid may be available for those who qualify. The displayed options may include sponsored or recommended results, not necessarily based on your preferences.
© HealthcareDegreeSearch.com – All Rights Reserved.