Physicians and Surgeons in Vermont
Considering a career as a Physician or Surgeon in Vermont?
You’re in luck! Jobs for Physicians and Surgeons in Vermont are projected to grow and these jobs tend to pay higher than average.
-
Projected employment for Physicians and Surgeons in Vermont is growing slower than average.
-
Physicians and Surgeons in Vermont earn higher salaries than the typical U.S. wage earner.
What Major Will Prepare You For a Physician or Surgeon Career?
- Health Professions
- Medicine
- Medicine
- Osteopathic Medicine
- Osteopathic Medicine/Osteopathy
- Residency Programs
- Medical Residency General Programs
- Aerospace Medicine Residency Program
- Allergy and Immunology Residency Program
- Child Neurology Residency Program
- Clinical Biochemical Genetics Residency Program
- Clinical Cytogenetics Residency Program
- Clinical Genetics Residency Program
- Clinical Molecular Genetics Residency Program
- Dermatology Residency Program
- Diagnostic Radiology Residency Program
- Emergency Medicine Residency Program
- Neurology Residency Program
- Nuclear Medicine Residency Program
- Occupational Medicine Residency Program
- Ophthalmology Residency Program
- Otolaryngology Residency Program
- Pathology Residency Program
- Physical Medicine and Rehabilitation Residency Program
- Public Health and General Preventive Medicine Residency Program
- Radiation Oncology Residency Program
- Radiologic Physics Residency Program
- Urology Residency Program
- Other Medical Residency Programs - General Certificates
- Medical Residency Specialty Programs
- Adolescent Medicine Residency Program
- Blood Banking/Transfusion Medicine Residency Program
- Cardiovascular Disease Residency Program
- Chemical Pathology Residency Program
- Child Abuse Pediatrics Residency Program
- Clinical Cardiac Electrophysiology Residency Program
- Clinical Neurophysiology Residency Program
- Critical Care Medicine Residency Program
- Cytopathology Residency Program
- Dermatopathology Residency Program
- Developmental-Behavioral Pediatrics Residency Program
- Diagnostic Radiologic Physics Residency Program
- Endocrinology, Diabetes and Metabolism Residency Program
- Forensic Pathology Residency Program
- Gastroenterology Residency Program
- Geriatric Medicine Residency Program
- Gynecologic Oncology Residency Program
- Hematological Pathology Residency Program
- Hematology Residency Program
- Hospice and Palliative Medicine Residency Program
- Immunopathology Residency Program
- Infectious Disease Residency Program
- Interventional Cardiology Residency Program
- Laboratory Medicine Residency Program
- Maternal and Fetal Medicine Residency Program
- Medical Biochemical Genetics Residency Program
- Medical Microbiology Residency Program
- Medical Nuclear Physics Residency Program
- Medical Oncology Residency Program
- Medical Toxicology Residency Program
- Molecular Genetic Pathology Residency Program
- Musculoskeletal Oncology Residency Program
- Neonatal-Perinatal Medicine Residency Program
- Nephrology Residency Program
- Neurodevelopmental Disabilities Residency Program
- Neuromuscular Medicine Residency Program
- Neuropathology Residency Program
- Neuroradiology Residency Program
- Neurotology Residency Program
- Nuclear Radiology Residency Program
- Orthopedic Sports Medicine Residency Program
- Pain Medicine Residency Program
- Pediatric Cardiology Residency Program
- Pediatric Critical Care Medicine Residency Program
- Pediatric Dermatology Residency Program
- Pediatric Emergency Medicine Residency Program
- Pediatric Endocrinology Residency Program
- Pediatric Gastroenterology Residency Program
- Pediatric Hematology-Oncology Residency Program
- Pediatric Infectious Diseases Residency Program
- Pediatric Nephrology Residency Program
- Pediatric Otolaryngology Residency Program
- Pediatric Pathology Residency Program
- Pediatric Pulmonology Residency Program
- Pediatric Radiology Residency Program
- Pediatric Rehabilitation Medicine Residency Program
- Pediatric Rheumatology Residency Program
- Pediatric Transplant Hepatology Residency Program
- Pediatric Urology Residency Program
- Physical Medicine and Rehabilitation/Psychiatry Residency Program
- Pulmonary Disease Residency Program
- Radioisotopic Pathology Residency Program
- Reproductive Endocrinology/Infertility Residency Program
- Rheumatology Residency Program
- Sleep Medicine Residency Program
- Spinal Cord Injury Medicine Residency Program
- Sports Medicine Residency Program
- Therapeutic Radiologic Physics Residency Program
- Transplant Hepatology Residency Program
- Undersea and Hyperbaric Medicine Residency Program
- Vascular and Interventional Radiology Residency Program
- Vascular Neurology Residency Program
- Other Medical Residency Programs - Subspecialty Certificates
How Many Physicians and Surgeons Work in Vermont?
In 2018, there were 790 Physicians and Surgeons working in the state.
There were 1,020 Physicians and Surgeons employed in this state in 2017.
That’s a decline of 230 jobs between 2017 and 2018.
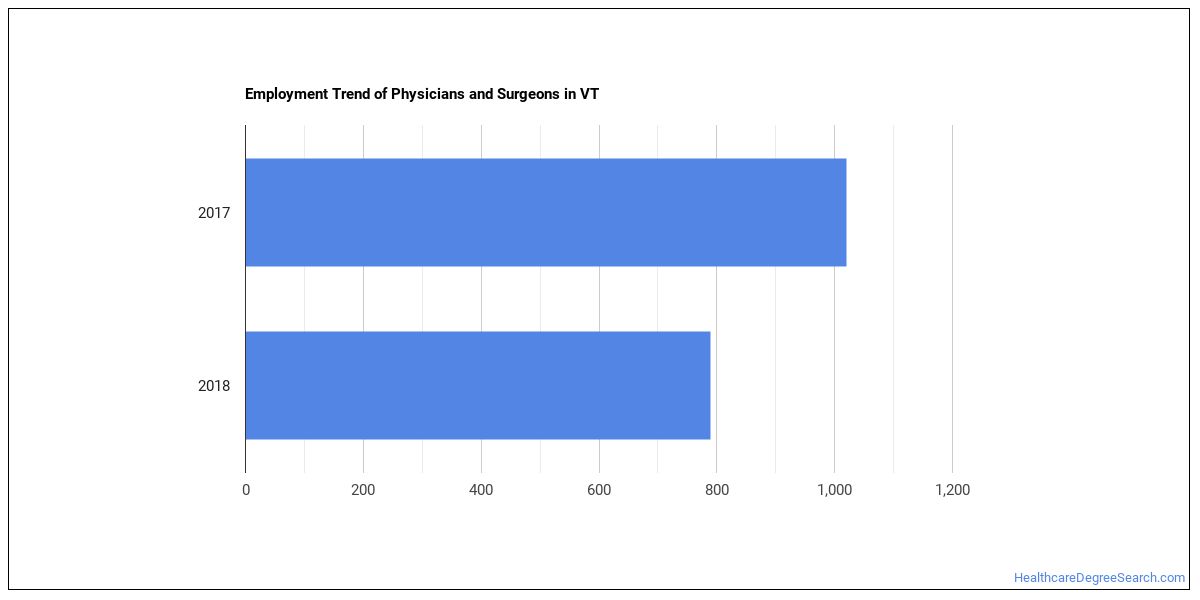
The typical state has 3,320 Physicians and Surgeons working in it, which means Vermont has fewer Physicians and Surgeons than average.

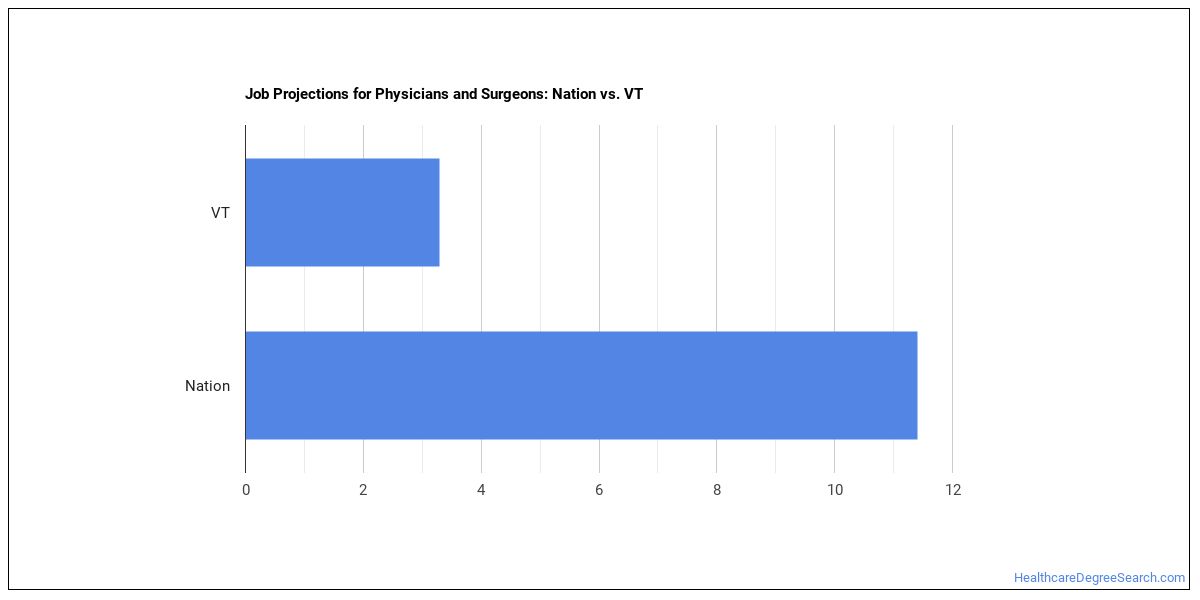
Job Projections for Vermont
Jobs for Physicians and Surgeons in this state are growing at a rate of 3.3% which is slower than the nationwide estimated projection of 11.4%.
Vermont Annual Job Openings
The BLS is projecting 40 annual Physicians and Surgeons job openings in Vermont, and 1,240 total jobs in the year 2026.
Nationwide, the prediction is 14,300 annual jobs and 414,700 total jobs in 2026.
What do Physicians and Surgeons Make in Vermont?
In 2018 wages for Physicians and Surgeons ranged from $58,000 to $208,000 with $151,020 being the median annual salary.
Broken down to an hourly rate, workers in this field made anywhere from $27.89 to $100. The median hourly rate was $72.61.
Workers in this field were paid a median of $100 an hour in 2017.
The hourly rate declined by $27.39.
The median salary in Vermont is higher than the nationwide median salary.

Explore Best Ranked Schools for You
Top States for Physicians and Surgeons Employment
View the list below to see where most Physicians and Surgeons work.
| State | Number Employed | Annual Median Salary |
|---|---|---|
| New York | 44,830 | $139,710 |
| California | 34,070 | $204,190 |
| Texas | 23,430 | $195,630 |
| Florida | 22,320 | $197,710 |
| Pennsylvania | 21,200 | $187,440 |
| Ohio | 17,020 | $208,000 |
| Massachusetts | 16,530 | $208,000 |
| Michigan | 16,480 | $173,480 |
| New Jersey | 15,380 | $208,000 |
| North Carolina | 13,380 | $196,670 |
| Maryland | 12,170 | $182,970 |
| Indiana | 10,730 | $208,000 |
| Georgia | 10,690 | $208,000 |
| Illinois | 9,940 | $160,050 |
| Virginia | 9,630 | $201,770 |
| Washington | 8,260 | $208,000 |
| Wisconsin | 7,050 | $208,000 |
| Connecticut | 6,970 | $208,000 |
| Tennessee | 6,100 | $208,000 |
| Oregon | 5,650 | $199,960 |
Below are the states where Physicians and Surgeons get paid the most:
| State | Annual Median Salary |
|---|---|
| Alaska | $208,000 |
| Arizona | $208,000 |
| Colorado | $208,000 |
| Connecticut | $208,000 |
| Delaware | $208,000 |
| Georgia | $208,000 |
| Hawaii | $208,000 |
| Idaho | $208,000 |
| Indiana | $208,000 |
| Iowa | $208,000 |
Related Careers in Vermont
Discover similar careers:
| Occupation | Vermont Employment Total |
|---|---|
| Family and General Practitioners | 580 |
| Pediatricians, General | 140 |
| Psychiatrists | 130 |
| Obstetricians and Gynecologists | 90 |
| Internists, General | 60 |
References
- Bureau of Labor Statistics (BLS)
- College Factual
- National Center for Education Statistics
- O*NET Online
More about our data sources and methodologies.
HealthcareDegreeSearch.com provides higher-education, college and university, degree, program, career, salary, and other helpful information to students, faculty, institutions, and other internet audiences. Presented information and data are subject to change. Inclusion on this website does not imply or represent a direct relationship with the company, school, or brand. Information, though believed correct at time of publication, may not be correct, and no warranty is provided. Contact the schools to verify any information before relying on it. Financial aid may be available for those who qualify. The displayed options may include sponsored or recommended results, not necessarily based on your preferences.
© HealthcareDegreeSearch.com – All Rights Reserved.