Surgeons in South Carolina
Considering a career as a Surgeon in South Carolina?
You’re in luck! Jobs for Surgeons in South Carolina are projected to grow and these jobs tend to pay higher than average.
-
Projected employment for Surgeons in South Carolina is growing faster than average.
-
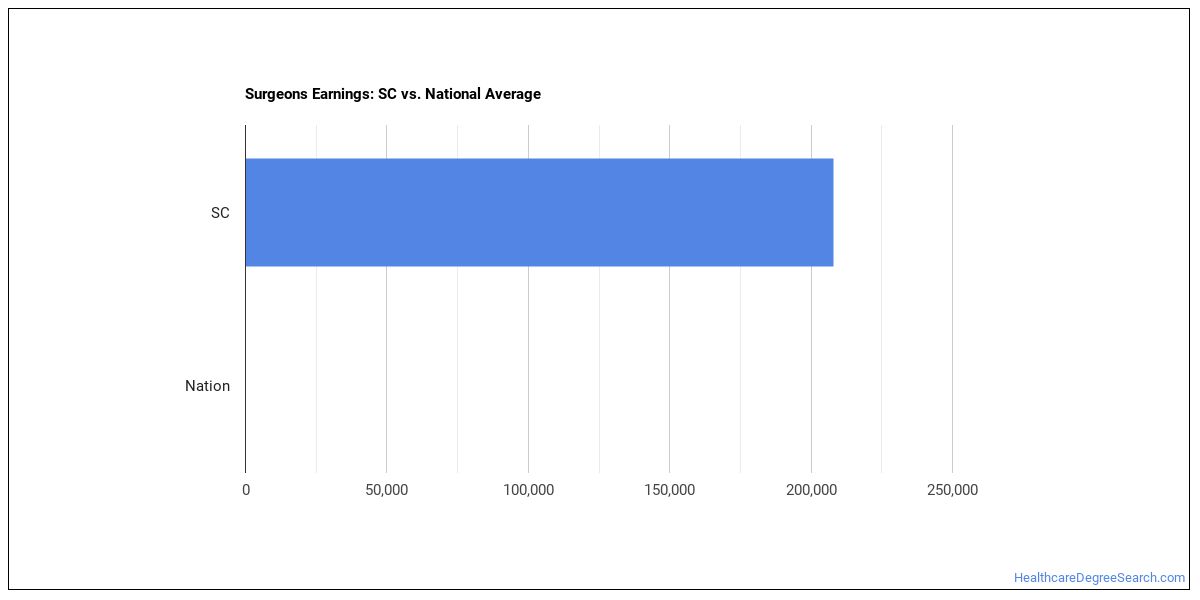
Surgeons in South Carolina earn higher salaries than the typical U.S. wage earner.
What Major Will Prepare You For a Surgeon Career?
- Residency Programs
- Medical Residency General Programs
- Colon and Rectal Surgery Residency Program
- General Surgery Residency Program
- Neurological Surgery Residency Program
- Orthopedic Surgery Residency Program
- Plastic Surgery Residency Program
- Thoracic Surgery Residency Program
- Vascular Surgery Residency Program
- Medical Residency Specialty Programs
- Congenital Cardiac Surgery Residency Program
- Orthopedic Surgery of the Spine Residency Program
- Pediatric Orthopedics Residency Program
- Pediatric Surgery Residency Program
- Plastic Surgery Within the Head and Neck Residency Program
- Surgery of the Hand Residency Program
- Surgical Critical Care Residency Program
What do Surgeons Make in South Carolina?
In 2018 wages for Surgeons ranged from $208,000 to $208,000 with $208,000 being the median annual salary.
Broken down to an hourly rate, workers in this field made anywhere from $100 to $100. The median hourly rate was $100.
The median salary in South Carolina is higher than the nationwide median salary.
Explore Best Ranked Schools for You
Top South Carolina Metros for Surgeons
The table below shows some of the metros in this state with the most Surgeons.
| Metro | Number Employed | Annual Median Salary |
|---|---|---|
| Charlotte-Concord-Gastonia, NC-SC | 220 | $208,000 |
Top States for Surgeons Employment
The table below shows the states where most Surgeons work.
| State | Number Employed | Annual Median Salary |
|---|---|---|
| California | 3,090 | $208,000 |
| Ohio | 2,020 | $208,000 |
| Massachusetts | 1,990 | $208,000 |
| New York | 1,710 | $208,000 |
| Florida | 1,390 | $208,000 |
| Michigan | 1,320 | $208,000 |
| New Jersey | 1,310 | $208,000 |
| Illinois | 1,290 | $208,000 |
| Missouri | 1,240 | $208,000 |
| Minnesota | 1,050 | $208,000 |
| Virginia | 870 | $208,000 |
| North Carolina | 810 | $208,000 |
| Colorado | 730 | $208,000 |
| Indiana | 730 | $208,000 |
| Washington | 620 | $208,000 |
| Alabama | 560 | $208,000 |
| Connecticut | 520 | $208,000 |
| Maryland | 520 | $208,000 |
| Utah | 490 | $208,000 |
| Wisconsin | 490 | $208,000 |
Below are the states where Surgeons get paid the most:
| State | Annual Median Salary |
|---|---|
| Alabama | $208,000 |
| Alaska | $208,000 |
| Arizona | $208,000 |
| Arkansas | $208,000 |
| California | $208,000 |
| Colorado | $208,000 |
| Connecticut | $208,000 |
| Delaware | $208,000 |
| District of Columbia | $208,000 |
| Florida | $208,000 |
Related Careers in South Carolina
You may also be interested in the following careers:
| Occupation | South Carolina Employment Total |
|---|---|
| Physicians and Surgeons | 3,100 |
| Family and General Practitioners | 2,710 |
| Anesthesiologists | 900 |
| Internists, General | 720 |
| Psychiatrists | 230 |
| Pediatricians, General | 210 |
| Obstetricians and Gynecologists | 130 |
References
- Bureau of Labor Statistics (BLS)
- College Factual
- National Center for Education Statistics
- O*NET Online
More about our data sources and methodologies.
HealthcareDegreeSearch.com provides higher-education, college and university, degree, program, career, salary, and other helpful information to students, faculty, institutions, and other internet audiences. Presented information and data are subject to change. Inclusion on this website does not imply or represent a direct relationship with the company, school, or brand. Information, though believed correct at time of publication, may not be correct, and no warranty is provided. Contact the schools to verify any information before relying on it. Financial aid may be available for those who qualify. The displayed options may include sponsored or recommended results, not necessarily based on your preferences.
© HealthcareDegreeSearch.com – All Rights Reserved.