Surgical Technologists in Pennsylvania
Want to work as a Surgical Technologists in Pennsylvania? Here’s what the data says. Assist in operations, under the supervision of surgeons, registered nurses, or other surgical personnel. May help set up operating room, prepare and transport patients for surgery, adjust lights and equipment, pass instruments and other supplies to surgeons and surgeons’ assistants, hold retractors, cut sutures, and help count sponges, needles, supplies, and instruments. Excludes “Surgical Assistants” (29-9093).
What do Surgical Technologists Make in Pennsylvania?
The surgical technologists working in Pennsylvania, the typical annual salary is $61,770 per year (or about $29.70/hour).Pay can range from $47,950 at the 10th percentile to $78,920 at the 90th percentile.
| Wage Statistic | Annual | Hourly |
|---|---|---|
| 10th percentile | $47,950 | $23.05 |
| 25th percentile | $52,370 | $25.18 |
| Median (50th) | $61,770 | $29.70 |
| 75th percentile | $72,470 | $34.84 |
| 90th percentile | $78,920 | $37.94 |

The location quotient — a measure of how concentrated this occupation is in Pennsylvania compared to the national average — is 1.06.
National Wage Comparison
Nationally, surgical technologists earn a median of $73,045 per year ($35.12/hour), lower than the Pennsylvania median.

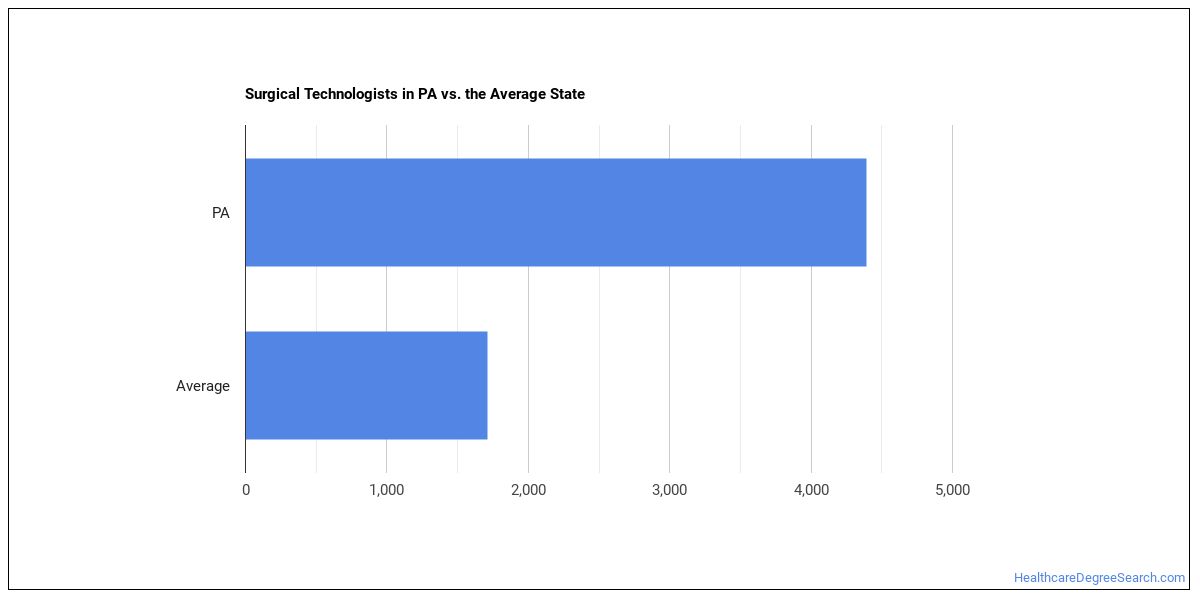
Employment Outlook
There are roughly 1,876,778 surgical technologists across the United States. In Pennsylvania alone, approximately 4,710 people work in this role. That puts the state above the typical state, which employs around 1,900 surgical technologists.

Top Pennsylvania Metros for Surgical Technologists
The metro areas below employ the most surgical technologists in Pennsylvania.
| Metro Area | Number Employed | Annual Median Salary |
|---|---|---|
| Philadelphia-Camden-Wilmington, PA-NJ-DE-MD | 2,190 | $64,950 |
| Pittsburgh, PA | 920 | $61,340 |
| Allentown-Bethlehem-Easton, PA-NJ | 410 | $61,220 |
| Harrisburg-Carlisle, PA | 330 | $61,730 |
| Scranton–Wilkes-Barre, PA | 200 | $59,420 |
| Lancaster, PA | 190 | $60,070 |
| York-Hanover, PA | 180 | $64,820 |
| Erie, PA | 120 | $51,840 |
| Reading, PA | 90 | $65,040 |
| Williamsport, PA | 80 | $65,000 |
| Altoona, PA | 40 | $48,690 |
Top States for Surgical Technologists Employment
View the states that employ the most surgical technologists work.
| State | Number Employed |
|---|---|
| California | 10,570 |
| Texas | 9,870 |
| Florida | 8,620 |
| New York | 5,910 |
| Pennsylvania | 4,710 |
| Georgia | 4,100 |
| Michigan | 3,910 |
| Ohio | 3,800 |
| Illinois | 3,730 |
| North Carolina | 3,720 |
| Wisconsin | 2,770 |
| New Jersey | 2,720 |
| Indiana | 2,610 |
| Alabama | 2,610 |
| South Carolina | 2,480 |
| Tennessee | 2,470 |
| Washington | 2,380 |
| Colorado | 2,310 |
| Virginia | 2,250 |
| Massachusetts | 2,240 |
Highest-Paying States for Surgical Technologists
Where surgical technologists earn the most: surgical technologists.
| State | Annual Median Salary |
|---|---|
| California | $81,120 |
| Connecticut | $80,590 |
| Oregon | $79,410 |
| Alaska | $79,040 |
| Massachusetts | $78,300 |
| Minnesota | $77,950 |
| Nevada | $76,740 |
| Hawaii | $76,200 |
| New York | $75,250 |
| Washington | $73,460 |
Skills
Top surgical technologists skills, rated on an importance scale of 0 to 5:
Knowledge Areas
Important knowledge areas for this occupation, rated on an importance scale of 0 to 5:
Abilities
The abilities that matter most for surgical technologists, rated on an importance scale of 0 to 5:
Daily Tasks
Day-to-day, surgical technologists typically:
- Maintain a proper sterile field during surgical procedures.
- Count sponges, needles, and instruments before and after operation.
- Scrub arms and hands and assist the surgical team to scrub and put on gloves, masks, and surgical clothing.
- Provide technical assistance to surgeons, surgical nurses, or anesthesiologists.
- Prepare patients for surgery, including positioning patients on the operating table and covering them with sterile surgical drapes to prevent exposure.
- Hand instruments and supplies to surgeons and surgeons' assistants, hold retractors and cut sutures, and perform other tasks as directed by surgeon during operation.
- Prepare, care for, and dispose of tissue specimens taken for laboratory analysis.
- Wash and sterilize equipment, using germicides and sterilizers.
- Monitor and continually assess operating room conditions, including patient and surgical team needs.
- Operate, assemble, adjust, or monitor sterilizers, lights, suction machines, or diagnostic equipment to ensure proper operation.
- Prepare dressings or bandages and apply or assist with their application following surgery.
- Clean and restock operating room, gathering and placing equipment and supplies and arranging instruments according to instructions, such as a preference card.
Work Activities
- Getting Information
- Assisting and Caring for Others
- Handling and Moving Objects
- Evaluating Information to Determine Compliance with Standards
- Inspecting Equipment, Structures, or Materials
- Identifying Objects, Actions, and Events
- Communicating with Supervisors, Peers, or Subordinates
- Updating and Using Relevant Knowledge
- Monitoring Processes, Materials, or Surroundings
- Establishing and Maintaining Interpersonal Relationships
- Making Decisions and Solving Problems
- Organizing, Planning, and Prioritizing Work
Tools & Technology
Software and systems commonly involved: Hot technologies: MEDITECH software
What Major Will Prepare You For This Career?
Programs that train for this career include:
- Allied Health Professions
- Clinical/Medical Laboratory Science
- Allied Health Services
Featured schools near , edit
Related Careers
Careers similar to surgical technologists include:
- Anesthesiologist Assistants
- Radiation Therapists
- Respiratory Therapists
- Nurse Anesthetists
- Anesthesiologists
- Orthopedic Surgeons, Except Pediatric
Also Known As
Cardiovascular Operating Room Technologist (CVOR Technologist), Certified Surgical Technician, Certified Surgical Technologist (CST), Operating Room Surgical Technician (OR St), Operating Room Surgical Technologist, Operating Room Technician (OR Tech), Operating Room Technologist (OR Tech), Scrub Technician, Surgery Technician (Surgery Tech), Surgical Orderly, Surgical Scrub Technician, Surgical Scrub Technologist (Surgical Scrub Tech), Surgical Technician, Surgical Technologist (Surgical Tech), Travel OR Tech (Travel Operating Room Technician).
References
- U.S. Bureau of Labor Statistics, Occupational Employment and Wage Statistics — https://www.bls.gov/oes/
- O*NET Online — https://www.onetonline.org/
- BLS Employment Projections — https://www.bls.gov/emp/
- O*NET-SOC code: 29-2055.00
HealthcareDegreeSearch.com provides higher-education, college and university, degree, program, career, salary, and other helpful information to students, faculty, institutions, and other internet audiences. Presented information and data are subject to change. Inclusion on this website does not imply or represent a direct relationship with the company, school, or brand. Information, though believed correct at time of publication, may not be correct, and no warranty is provided. Contact the schools to verify any information before relying on it. Financial aid may be available for those who qualify. The displayed options may include sponsored or recommended results, not necessarily based on your preferences.
© HealthcareDegreeSearch.com – All Rights Reserved.