Brookline College - Tempe Healthcare Programs
Brookline College - Tempe is a private for-profit institution situated in Tempe, Arizona. The location of the school is great for students who enjoy the amenities of city life.
Featured schools near , edit
Where Is Brookline College - Tempe?
Contact details for Brookline College - Tempe are given below.
| Contact Details | |
|---|---|
| Address: | 1140-1150 S. Priest Drive, Tempe, AZ 85281 |
| Phone: | 888-793-0557 |
| Website: | www.brooklinecollege.edu |
How Do I Get Into Brookline College - Tempe?
You can apply to Brookline College - Tempe online at: https://www.brooklinecollege.edu/admissions/application/
Can I Afford Brookline College - Tempe?
Student Loan Debt
It's not uncommon for college students to take out loans to pay for school. In fact, almost 66% of students nationwide depend at least partially on loans. At Brookline College - Tempe, approximately 67% of students took out student loans averaging $5,659 a year. That adds up to $22,636 over four years for those students.
Brookline College - Tempe Undergraduate Student Diversity
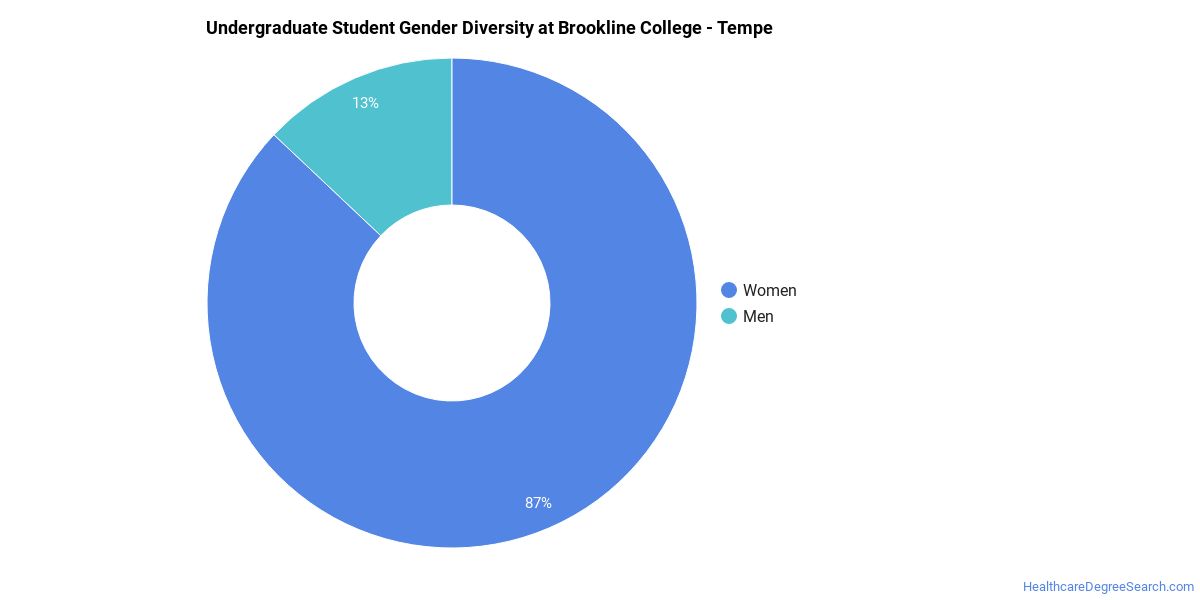
Gender Diversity
Of the 520 full-time undergraduates at Brookline College - Tempe, 10% are male and 90% are female.
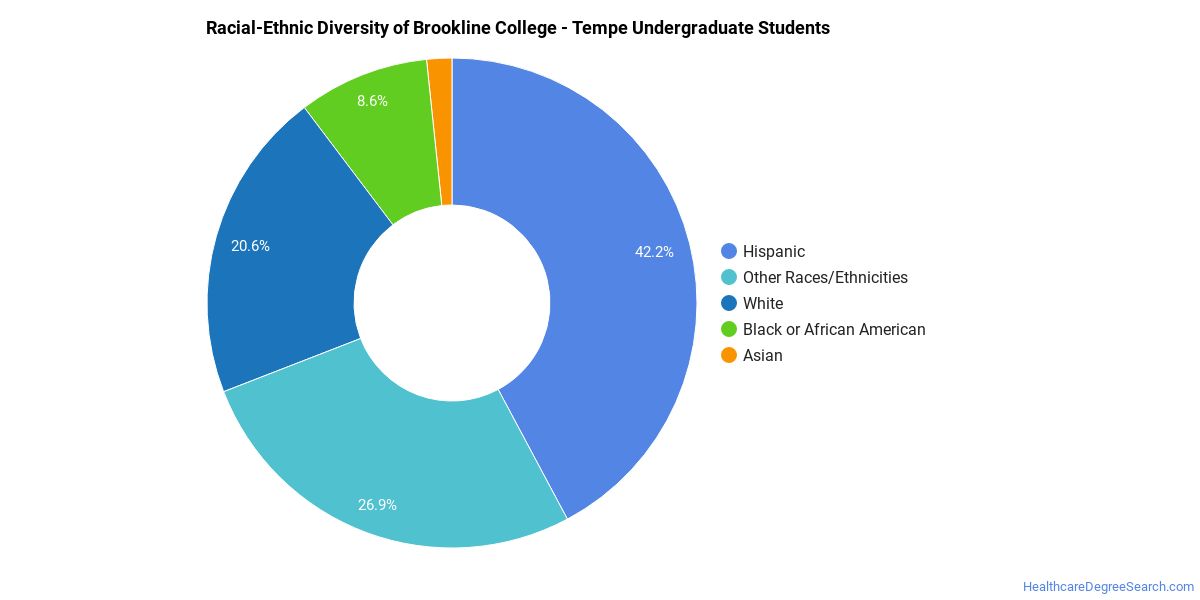
Racial-Ethnic Diversity
The racial-ethnic breakdown of Brookline College - Tempe students is as follows.
| Race/Ethnicity | Number of Grads |
|---|---|
| Asian | 5 |
| Black or African American | 56 |
| Hispanic or Latino | 210 |
| White | 109 |
| International Students | 0 |
| Other Races/Ethnicities | 140 |
Brookline College - Tempe Healthcare Concentrations
The table below shows the number of awards for each concentration.
| Major | Basic Certificate | Associate’s | Undergraduate Certificate | TOTAL |
|---|---|---|---|---|
| Surgical Technology | 0 | 64 | 0 | 64 |
| Medical/Clinical Assistant | 14 | 0 | 0 | 14 |
| Dental Assisting/Assistant | 0 | 0 | 10 | 10 |
| Medical Insurance Coding Specialist/Coder | 9 | 0 | 0 | 9 |
| Sterile Processing Technology/Technician | 0 | 0 | 6 | 6 |
| Nursing Assistant/Aide and Patient Care Assistant/Aide | 4 | 0 | 0 | 4 |
| Pharmacy Technician/Assistant | 2 | 0 | 0 | 2 |
| TOTAL | 29 | 64 | 16 | 109 |
References
*The racial-ethnic minorities count is calculated by taking the total number of students and subtracting white students, international students, and students whose race/ethnicity was unknown. This number is then divided by the total number of students at the school to obtain the racial-ethnic minorities percentage.
More about our data sources and methodologies.
HealthcareDegreeSearch.com provides higher-education, college and university, degree, program, career, salary, and other helpful information to students, faculty, institutions, and other internet audiences. Presented information and data are subject to change. Inclusion on this website does not imply or represent a direct relationship with the company, school, or brand. Information, though believed correct at time of publication, may not be correct, and no warranty is provided. Contact the schools to verify any information before relying on it. Financial aid may be available for those who qualify. The displayed options may include sponsored or recommended results, not necessarily based on your preferences.
© HealthcareDegreeSearch.com – All Rights Reserved.