Davidson County Community College Healthcare Programs
Davidson County Community College is a public institution situated in Thomasville, North Carolina. Students who love country life may enjoy the rural location of DCCC.
Featured schools near , edit
Where Is Davidson County Community College?
Contact details for DCCC are given below.
| Contact Details | |
|---|---|
| Address: | 297 Dcc Road, Thomasville, NC 27360-7385 |
| Phone: | 336-249-8186 |
| Website: | www.davidsondavie.edu |
How Do I Get Into DCCC?
You can apply to DCCC online at: https://www.davidsondavie.edu/admissions/how-to-apply/apply-for-admissions/
Can I Afford Davidson County Community College?
Student Loan Debt
While almost two-thirds of students nationwide take out loans to pay for college, the percentage may be quite different for the school you plan on attending. At DCCC, approximately 21% of students took out student loans averaging $5,957 a year. That adds up to $23,828 over four years for those students.
Davidson County Community College Undergraduate Student Diversity
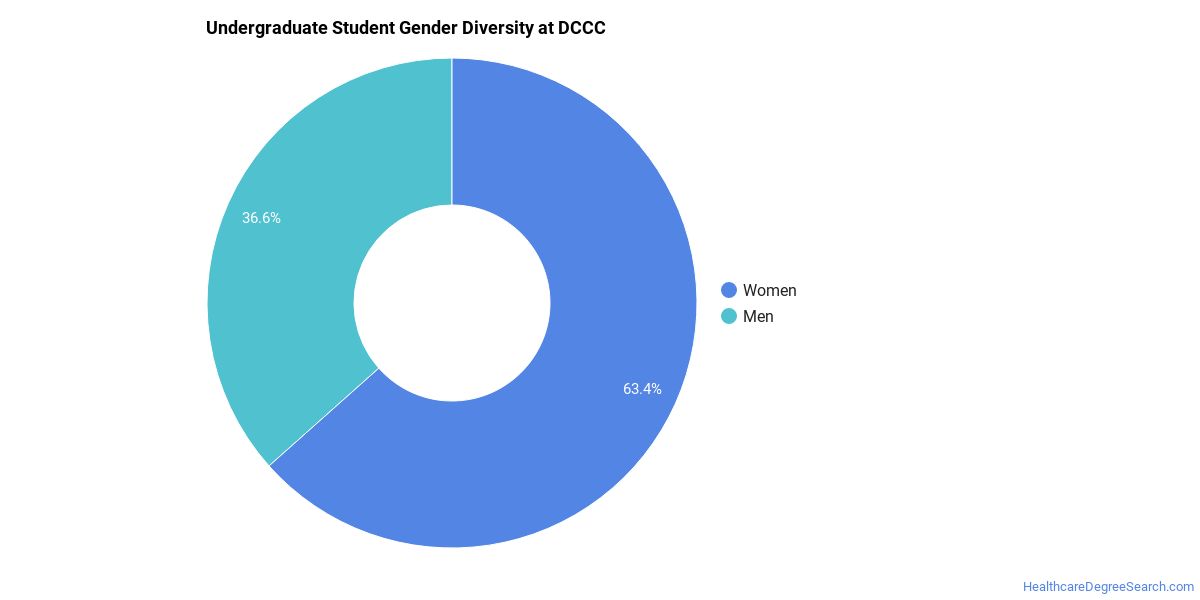
Gender Diversity
Of the 1,537 full-time undergraduates at DCCC, 37% are male and 63% are female.
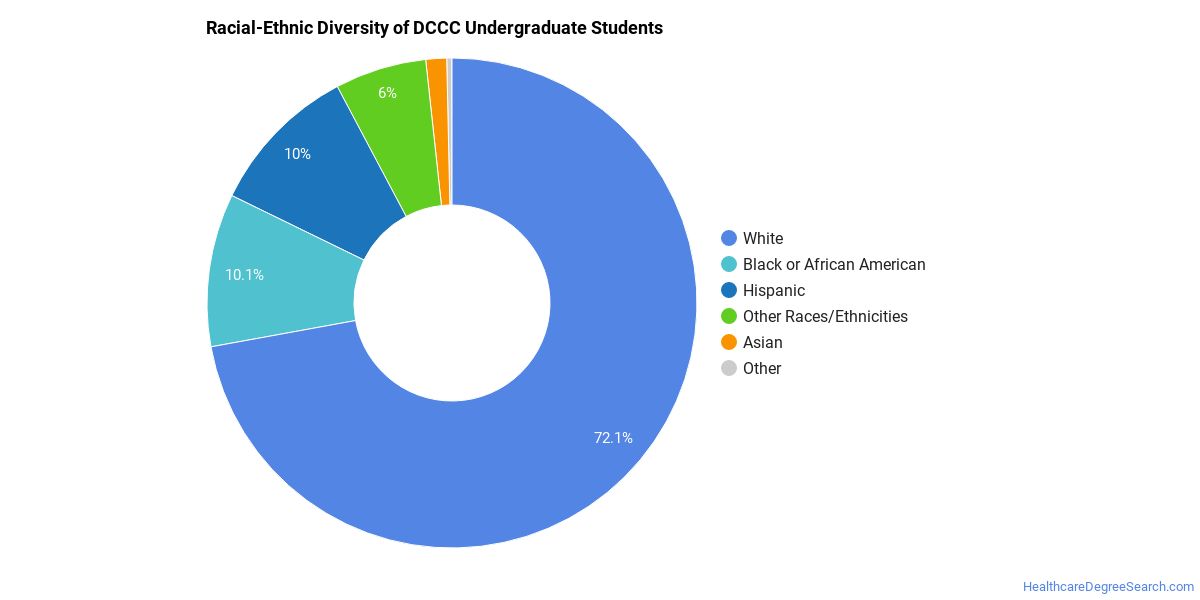
Racial-Ethnic Diversity
The racial-ethnic breakdown of Davidson County Community College students is as follows.
| Race/Ethnicity | Number of Grads |
|---|---|
| Asian | 30 |
| Black or African American | 173 |
| Hispanic or Latino | 115 |
| White | 1,109 |
| International Students | 1 |
| Other Races/Ethnicities | 109 |
Davidson County Community College Healthcare Concentrations
The table below shows the number of awards for each concentration.
| Major | Basic Certificate | Associate’s | Undergraduate Certificate | TOTAL |
|---|---|---|---|---|
| Registered Nursing | 0 | 79 | 0 | 79 |
| Nursing Assistant/Aide and Patient Care Assistant/Aide | 34 | 0 | 0 | 34 |
| Medical/Clinical Assistant | 2 | 10 | 11 | 23 |
| Licensed Practical/Vocational Nurse Training | 0 | 0 | 20 | 20 |
| Pharmacy Technician/Assistant | 5 | 6 | 5 | 16 |
| Other Mental and Social Health Services and Allied Professions | 1 | 7 | 6 | 14 |
| Laboratory Technician | 0 | 12 | 0 | 12 |
| Health Information Management | 0 | 12 | 0 | 12 |
| Health Information/Medical Records Technology/Technician | 3 | 8 | 0 | 11 |
| Dental Assisting/Assistant | 0 | 0 | 9 | 9 |
| Emergency Medical Technology/Technician (EMT Paramedic) | 2 | 6 | 0 | 8 |
| Surgical Technology | 0 | 7 | 0 | 7 |
| Massage Therapy/Therapeutic Massage | 0 | 0 | 7 | 7 |
| Sterile Processing Technology/Technician | 6 | 0 | 0 | 6 |
| Substance Abuse/Addiction Counseling | 3 | 0 | 0 | 3 |
| Pre-Nursing Studies | 0 | 2 | 0 | 2 |
| TOTAL | 56 | 149 | 58 | 263 |
References
*The racial-ethnic minorities count is calculated by taking the total number of students and subtracting white students, international students, and students whose race/ethnicity was unknown. This number is then divided by the total number of students at the school to obtain the racial-ethnic minorities percentage.
More about our data sources and methodologies.
HealthcareDegreeSearch.com provides higher-education, college and university, degree, program, career, salary, and other helpful information to students, faculty, institutions, and other internet audiences. Presented information and data are subject to change. Inclusion on this website does not imply or represent a direct relationship with the company, school, or brand. Information, though believed correct at time of publication, may not be correct, and no warranty is provided. Contact the schools to verify any information before relying on it. Financial aid may be available for those who qualify. The displayed options may include sponsored or recommended results, not necessarily based on your preferences.
© HealthcareDegreeSearch.com – All Rights Reserved.