Finlandia University Healthcare Programs
Finlandia University is a private not-for-profit institution situated in Hancock, Michigan. Hancock is a good match for students who enjoy small-town life.
Featured schools near , edit
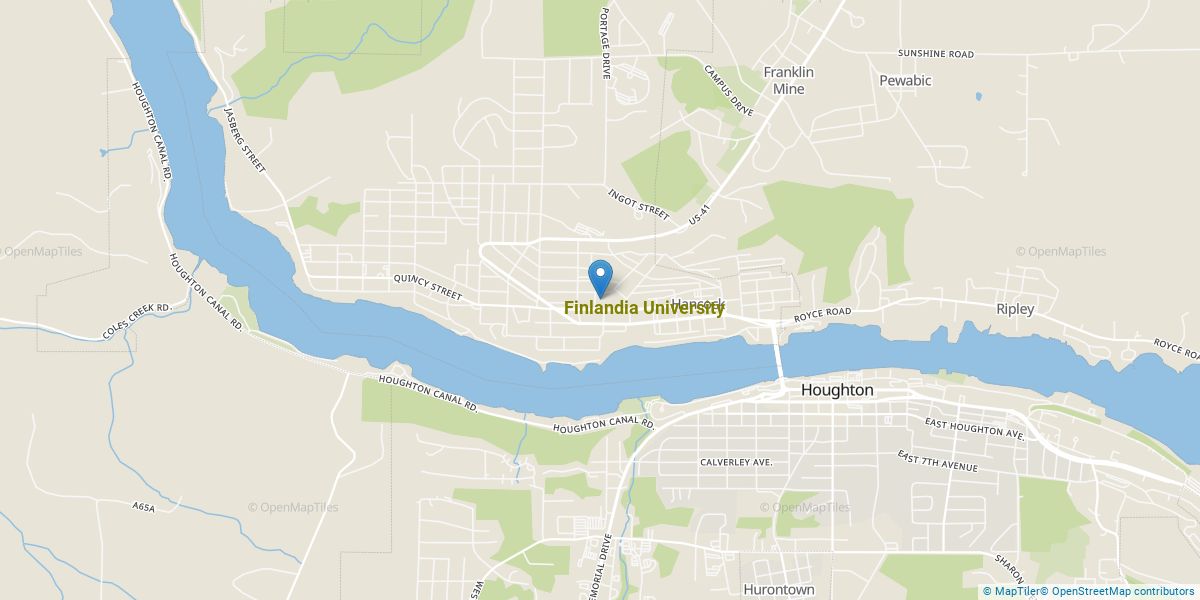
Where Is Finlandia University?
Contact details for Finlandia are given below.
| Contact Details | |
|---|---|
| Address: | 601 Quincy St, Hancock, MI 49930-1832 |
| Phone: | 906-482-5300 |
| Website: | www.finlandia.edu |
How Do I Get Into Finlandia?
You can apply to Finlandia online at: www.finlandia.edu/admissions.html
Admission Requirements for Finlandia
| Submission | Required? |
|---|---|
| High School GPA | 1 |
| High School Rank | 5 |
| High School Transcript | 1 |
| College Prep Program | 5 |
| Recommendations | 3 |
| SAT or ACT Scores | 3 |
| TOEFL | 1 |
How Hard Is It To Get Into Finlandia?
Approximately 73% of accepted students are men and 27% are women. The acceptance rate for men is 69%, and the acceptance rate for women is 61%.
Can I Afford Finlandia University?
The net price is calculated by adding tuition, room, board and other costs and subtracting financial aid.
Student Loan Debt
Almost 66% of college students who graduated with the class of 2018 took out student loans, but that percentage varies from school to school. At Finlandia, approximately 79% of students took out student loans averaging $7,948 a year. That adds up to $31,792 over four years for those students.
Finlandia University Undergraduate Student Diversity
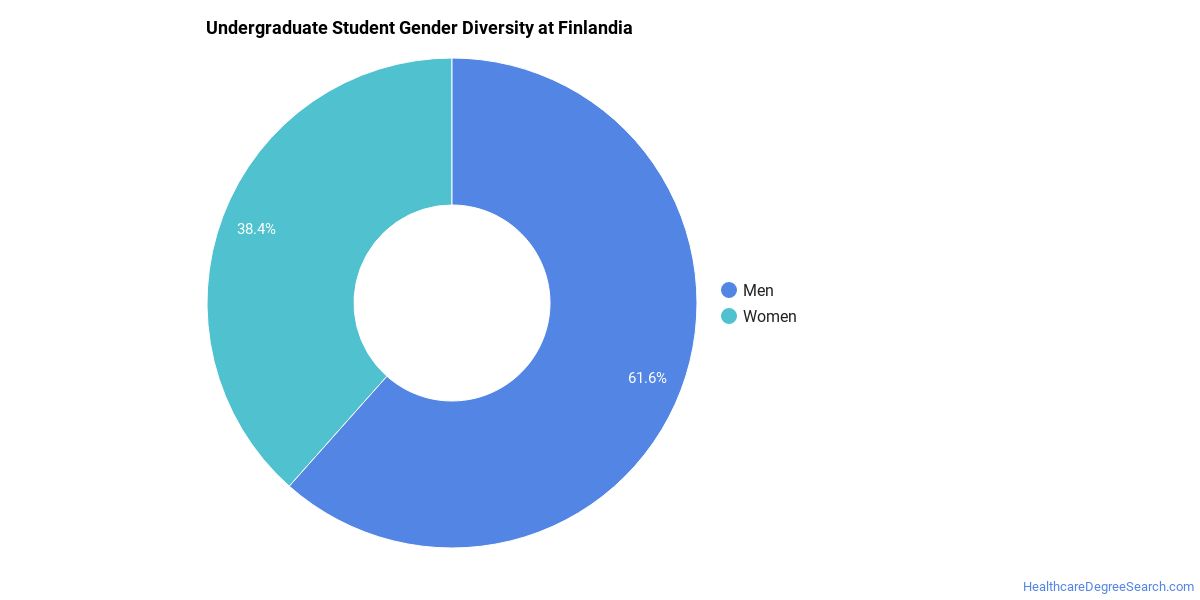
Gender Diversity
Of the 385 full-time undergraduates at Finlandia, 62% are male and 38% are female.
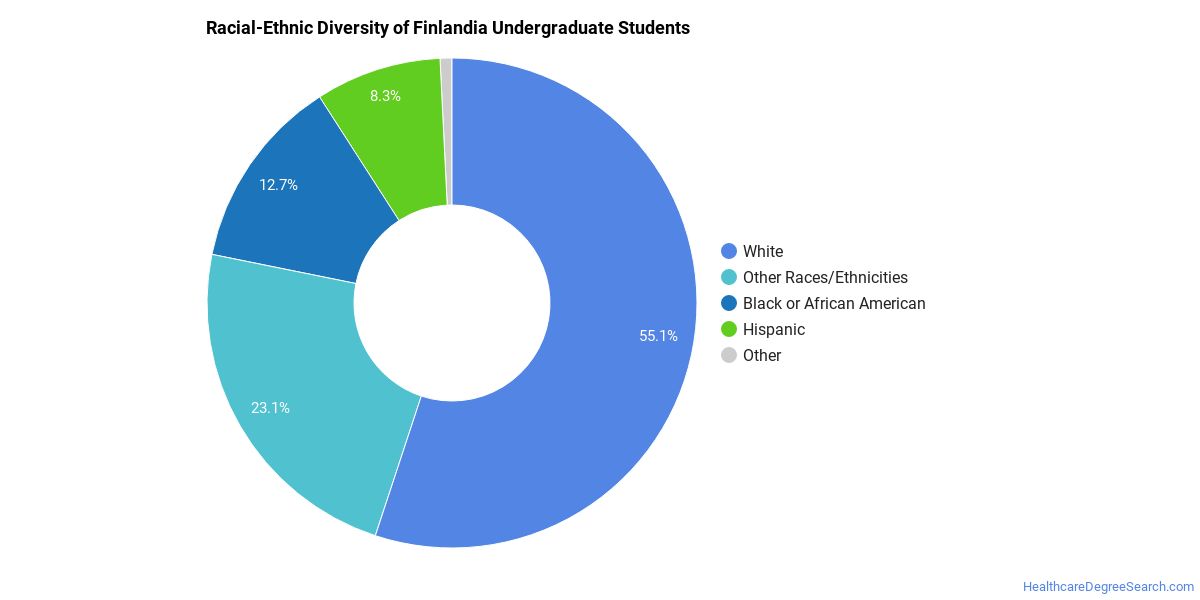
Racial-Ethnic Diversity
The racial-ethnic breakdown of Finlandia University students is as follows.
| Race/Ethnicity | Number of Grads |
|---|---|
| Asian | 2 |
| Black or African American | 49 |
| Hispanic or Latino | 32 |
| White | 212 |
| International Students | 1 |
| Other Races/Ethnicities | 89 |
Geographic Diversity
Michigan students aren't the only ones who study at Finlandia University. At this time, 21 states are represented by the student population at the school.
Over 14 countries are represented at Finlandia. The most popular countries sending students to the school are Finland, Canada, and Japan.
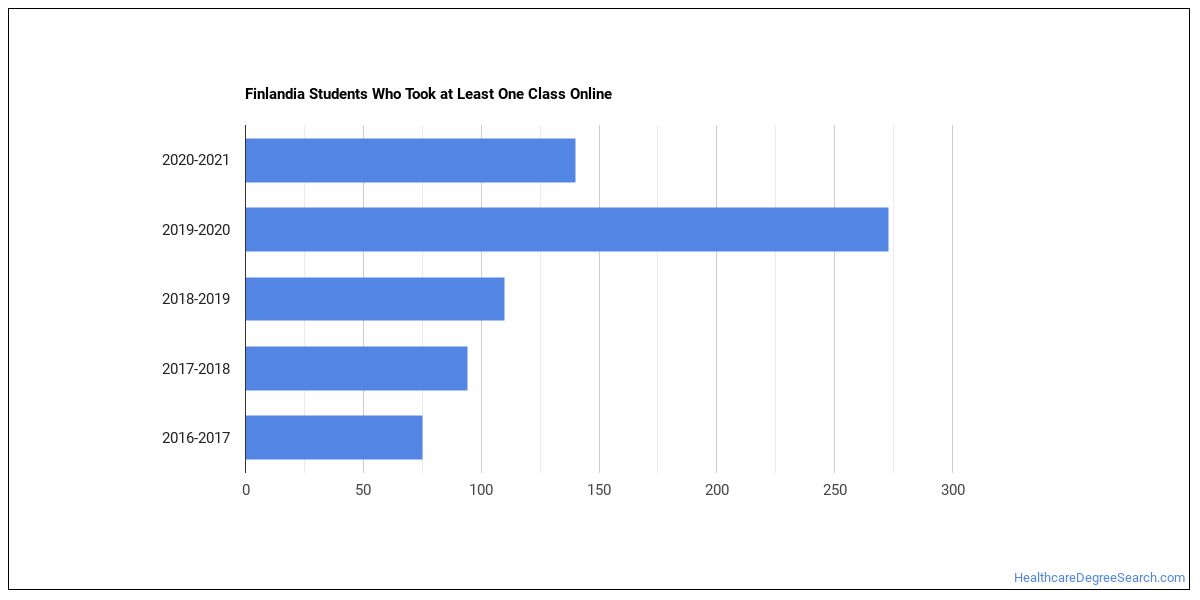
Online Learning at Finlandia University
The following chart shows how the online learning population at Finlandia has changed over the last few years.
Finlandia University Healthcare Concentrations
The table below shows the number of awards for each concentration.
| Major | Associate’s | Bachelor’s | TOTAL |
|---|---|---|---|
| Registered Nursing | 0 | 23 | 23 |
| Physical Therapy Assistant | 11 | 0 | 11 |
| Art Therapy | 0 | 1 | 1 |
| Medical/Clinical Assistant | 0 | 0 | 0 |
| Health Information/Medical Records Technology/Technician | 0 | 0 | 0 |
| Other Health/Medical Preparatory Programs | 0 | 0 | 0 |
| TOTAL | 11 | 24 | 35 |
References
*The racial-ethnic minorities count is calculated by taking the total number of students and subtracting white students, international students, and students whose race/ethnicity was unknown. This number is then divided by the total number of students at the school to obtain the racial-ethnic minorities percentage.
More about our data sources and methodologies.
Featured Schools
 Request Info
|
Southern New Hampshire University You have goals. Southern New Hampshire University can help you get there. Whether you need a bachelor's degree to get into a career or want a master's degree to move up in your current career, SNHU has an online program for you. Find your degree from over 200 online programs. Learn More > |
HealthcareDegreeSearch.com provides higher-education, college and university, degree, program, career, salary, and other helpful information to students, faculty, institutions, and other internet audiences. Presented information and data are subject to change. Inclusion on this website does not imply or represent a direct relationship with the company, school, or brand. Information, though believed correct at time of publication, may not be correct, and no warranty is provided. Contact the schools to verify any information before relying on it. Financial aid may be available for those who qualify. The displayed options may include sponsored or recommended results, not necessarily based on your preferences.
© HealthcareDegreeSearch.com – All Rights Reserved.