Health Sciences & Services at Lindenwood University
If you plan to study Health Sciences & Services, consider the program at Lindenwood University. The following information will help you decide if it is a good fit for you.
Lindenwood University sits in Saint Charles, MO.
In the most recent year for which we have data, 4 health sciences & services degrees were granted at Lindenwood University.
Featured schools near , edit
Studying Online at Lindenwood University
Distance learning is available at Lindenwood University. Among 6,826 students, 3,177 (47%) studied exclusively online and 2,994 (44%) took at least some classes online.
Health Sciences & Services Rankings at Lindenwood University
Rankings can help you compare Lindenwood University’s Health Sciences & Services program to other colleges that offer this major.
Bachelor’s-Level Rankings
| Ranking | Scope | Rank |
|---|---|---|
| Best Schools (Quality) | Missouri | #None of 14 |
| Best Schools (Quality) | The Plains States (Region) | #None of 41 |
| Best Schools (Quality) | Nationwide | #None of 478 |
| Best Value | Missouri | #None of 14 |
| Best Value | The Plains States (Region) | #None of 40 |
| Best Value | Nationwide | #None of 471 |
Student Demographics & Diversity
Take a look at the student demographics for Health Sciences & Services graduates at Lindenwood University, broken down by degree level.
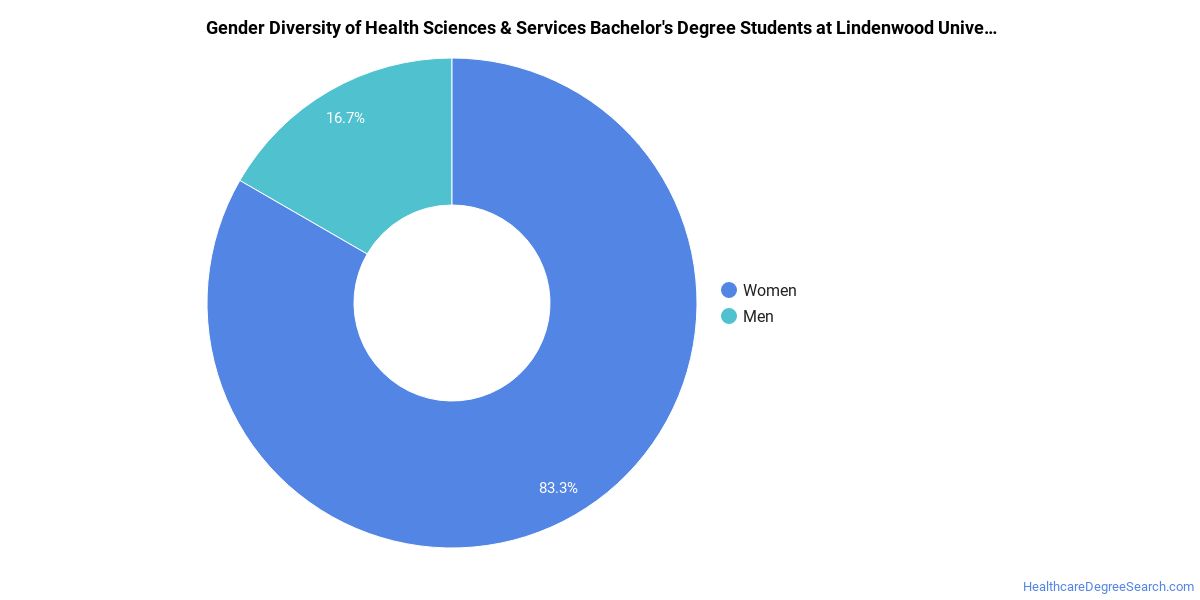
Looking at the program as a whole, Health Sciences & Services graduates at Lindenwood University are 50% women (2) and 50% men (2).
Health Sciences & Services Bachelor’s Program at Lindenwood University
Of the 4 bachelor’s health sciences & services graduates at Lindenwood University, 50% were women (2) and 50% were men (2).
The following table and chart show the race/ethnicity of Health Sciences & Services bachelor’s degree recipients at Lindenwood University.
| Race / Ethnicity | Number of Graduates |
|---|---|
| White | 2 |
| Black / African American | 1 |
| International (Nonresident) | 1 |
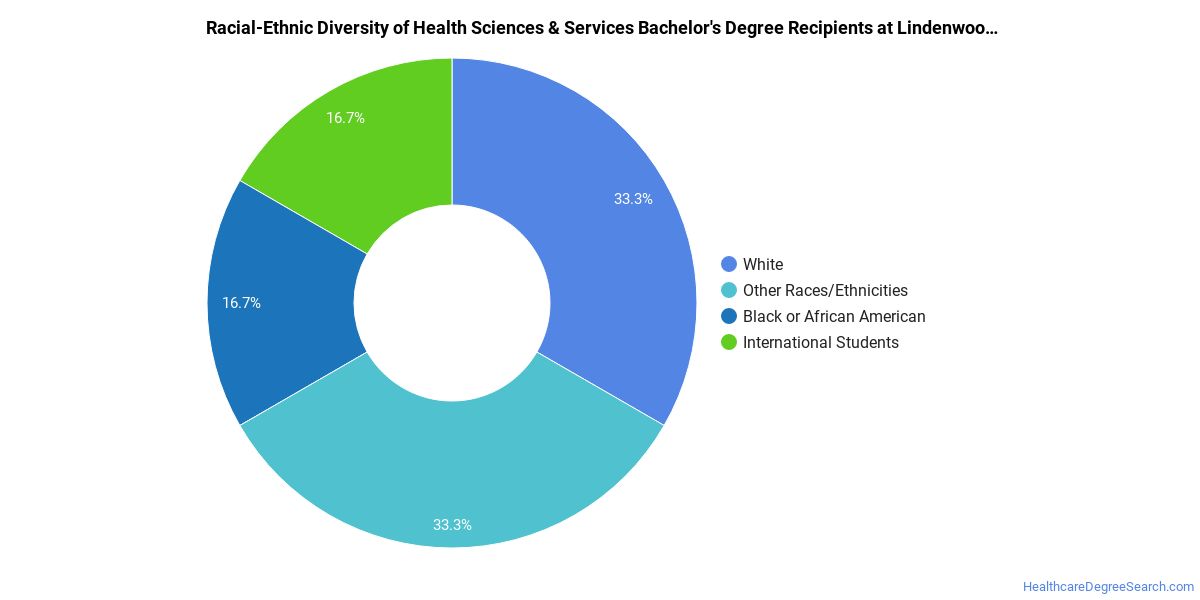
Minority students account for 25% of Health Sciences & Services bachelor’s degree recipients at Lindenwood University, below the national average of 50%.*
*The racial-ethnic minorities figure is the total number of graduates minus White, international (nonresident), and unknown-race graduates.
More Specific Health Sciences & Services Concentrations at Lindenwood University
This Health Sciences & Services program at Lindenwood University breaks down into more specific concentrations:
| Concentration | Graduates |
|---|---|
| General/Allied Health Sciences | 4 |
Highest-Paying Careers for Health Sciences & Services Graduates
Graduates of the Health Sciences & Services program at Lindenwood University pursue many career paths. Here are the top-paying careers for Health Sciences & Services graduates, ordered by median annual salary:
| Occupation | Nationwide Median Wage |
|---|---|
| Health Education Specialists | $81,726 |
| Community Health Workers | $73,901 |
References
- IPEDS — Integrated Postsecondary Education Data System
- U.S. Department of Education — College Scorecard
- O*NET Online (Bureau of Labor Statistics)
- National Center for Education Statistics
More about our data sources and methodologies.
HealthcareDegreeSearch.com provides higher-education, college and university, degree, program, career, salary, and other helpful information to students, faculty, institutions, and other internet audiences. Presented information and data are subject to change. Inclusion on this website does not imply or represent a direct relationship with the company, school, or brand. Information, though believed correct at time of publication, may not be correct, and no warranty is provided. Contact the schools to verify any information before relying on it. Financial aid may be available for those who qualify. The displayed options may include sponsored or recommended results, not necessarily based on your preferences.
© HealthcareDegreeSearch.com – All Rights Reserved.