Lindenwood University Healthcare Programs
Lindenwood University is a private not-for-profit institution located in Saint Charles, MO. A Smaller City provides an ideal setting close to urban amenities.
Featured schools near , edit
Lindenwood University Rankings
Lindenwood University has earned the following rankings for healthcare programs at the bachelors level:
| Ranking | Rank | Among |
|---|---|---|
| College Major Best Value | #2 of 5 | State — Missouri |
| Overall Quality | #4 of 4 | State — Missouri |
| Overall Quality | #5 of 9 | State — Missouri |
| College Major Best Value | #5 of 13 | State — Missouri |
| Overall Quality | #6 of 13 | State — Missouri |
| College Major Best Value | #6 of 9 | State — Missouri |
| Overall Quality | #8 of 22 | State — Missouri |
| College Major Best Value | #8 of 22 | Region — The Plains States |
Where Is Lindenwood University?
Contact details for Lindenwood University are listed below.
| Contact Details | |
|---|---|
| Address: | 209 S Kingshighway St, Saint Charles, MO 63301-1695 |
| Phone: | 6369492000 |
| Website: | www.lindenwood.edu/ |
| Admissions: | www.lindenwood.edu/admissions/ |
| Financial Aid: | www.lindenwood.edu/admissions/student-financial-services/ |
How Do I Get Into Lindenwood University?
You can apply to Lindenwood University online at: https://www.lindenwood.edu/admissions/apply/
Lindenwood University is classified as Moderately Selective (50-70%) for admissions.
Admission Requirements for Lindenwood University
Here’s what Lindenwood University requires for admission:
| Requirement | Status |
|---|---|
| Secondary School Record | Considered but not required |
| Secondary School GPA | Required |
| Recommendations | Considered but not required |
| Admission Test Scores (SAT/ACT) | Considered but not required |
How Hard Is It To Get Into Lindenwood University?
Lindenwood University admits 57%, which makes it fairly accessible. Be sure to prepare a complete application and prepare the application in full.
Of those admitted, 14% choose to enroll — a modest enrollment yield, suggesting many admitted students choose other institutions.
Average Test Scores
6% submitted ACT scores.
ACT Composite scores for admitted students at Lindenwood University ranged between 22 and 28.
Selectivity by Gender
Acceptance rates at Lindenwood University are broken out by gender below.
| Gender | Applicants | Admitted | Acceptance Rate |
|---|---|---|---|
| Men | 1,919 | 956 | 50% |
| Women | 3,208 | 1,717 | 54% |
Can I Afford Lindenwood University?
The average net price after aid at Lindenwood University is $18,516. Cost varies significantly based on your financial situation since net price varies by income group.
Tuition & Fees
| Category | Cost |
|---|---|
| In-State Tuition | $19,900 |
| In-State Fees | $1,700 |
| Out-of-State Tuition | $19,900 |
| Out-of-State Fees | $1,700 |
| Total In-State Tuition & Fees | $21,600 |
| Total Out-of-State Tuition & Fees | $21,600 |
Financial Aid
When including loans, work-study, and grants, 18% of students at Lindenwood University receive some form of financial aid (864 students).
Nearly 84% of students at Lindenwood University receive grant or scholarship aid, averaging $12,400 per student.
30% of students receive federal Pell Grants, averaging $5,664.
Student Loan Debt
49% of Lindenwood University undergraduates take out federal student loans, averaging $7,631 per year.
Lindenwood University Undergraduate Student Diversity
There are 4,602 students enrolled at Lindenwood University. Lindenwood University is classified as a 5,000 - 9,999 institution by enrollment size. Its Carnegie Classification is Master’s Colleges & Universities: Larger Programs.
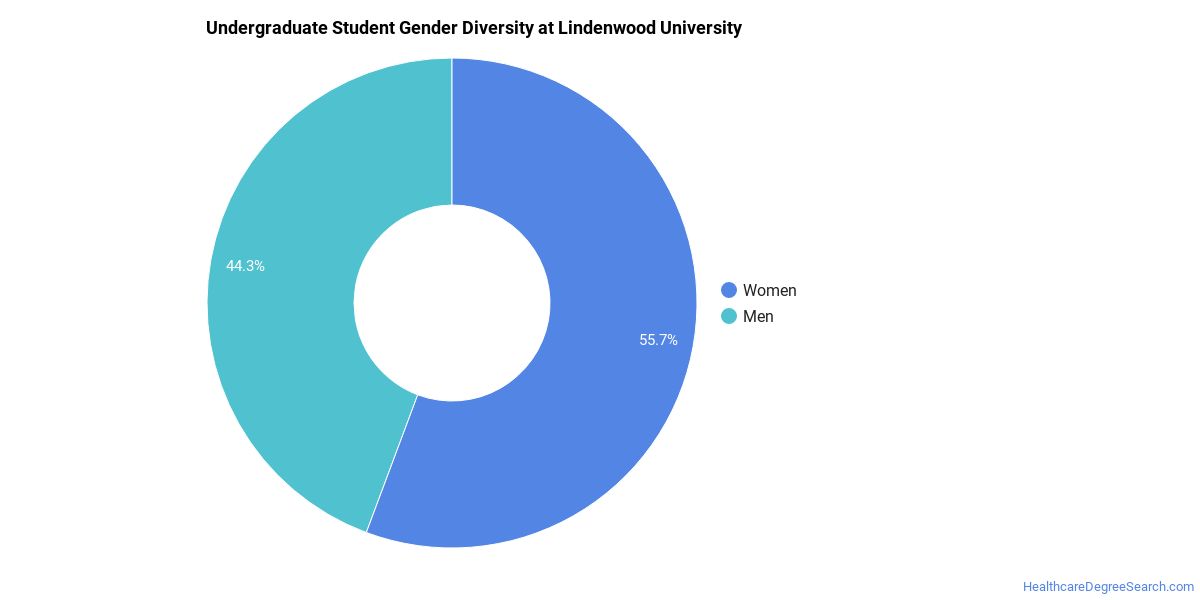
Gender Diversity
Of the 4,748 undergraduate students at Lindenwood University, approximately 40% are male and 60% are female.
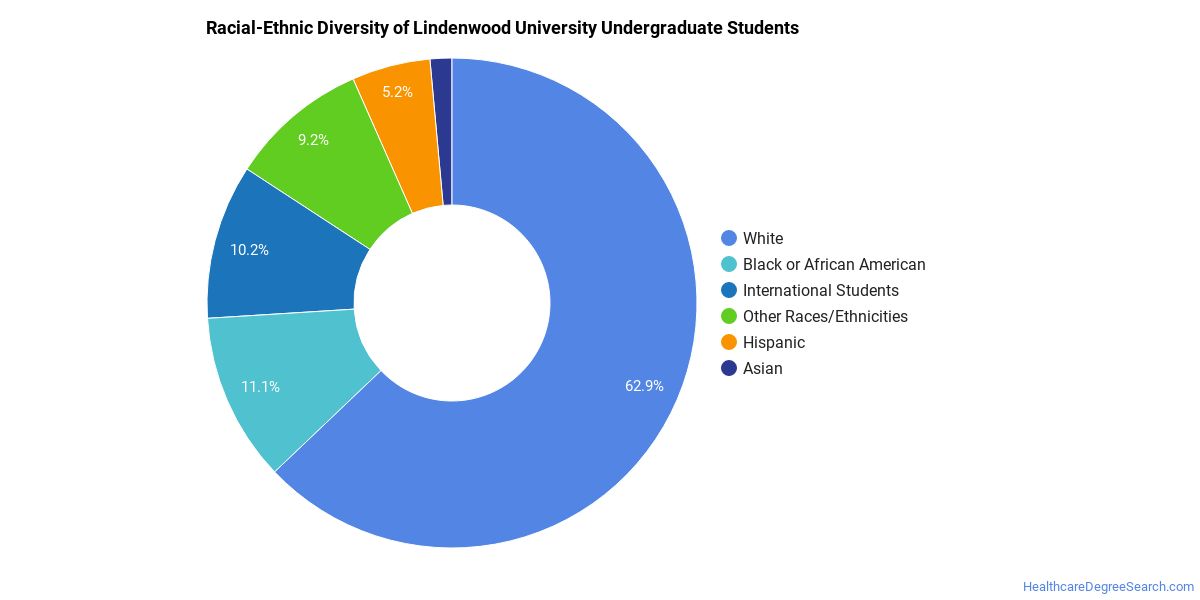
Racial-Ethnic Diversity
The racial-ethnic breakdown of Lindenwood University undergraduate students is as follows.
| Race/Ethnicity | Number of Students |
|---|---|
| Asian | 75 |
| Black or African American | 631 |
| Hispanic | 251 |
| White | 2,976 |
| American Indian/Alaska Native | 14 |
| Native Hawaiian/Pacific Islander | 23 |
| Two or More Races | 199 |
| Non-Resident | 265 |
Geographic Diversity
The top 5 home states of first-time undergraduate students at Lindenwood University break down as follows.

| State | First-Time UG Students |
|---|---|
| Missouri | 375 |
| Illinois | 81 |
| Texas | 16 |
| California | 14 |
| Florida | 14 |
Additionally, approximately 5.6% of undergraduate students are non-resident from outside the United States.
Lindenwood University Graduate Student Diversity
2,355 of Lindenwood University’s students are in graduate programs. The highest graduate-level award offered is Doctor’s degree.
Gender Diversity (Graduate)
Among graduate students at Lindenwood University, approximately 27% are male and 73% are female.

Racial-Ethnic Diversity (Graduate)
The racial-ethnic breakdown of Lindenwood University graduate students is as follows.

| Race/Ethnicity | Number of Students |
|---|---|
| Asian | 32 |
| Black or African American | 428 |
| Hispanic | 91 |
| White | 1,391 |
| American Indian/Alaska Native | 7 |
| Native Hawaiian/Pacific Islander | 4 |
| Two or More Races | 73 |
| Non-Resident | 47 |
Online Learning at Lindenwood University
Lindenwood University delivers online programs for students who need flexibility.
2,779 undergraduate students at Lindenwood University took at least one online class — of those, 1,316 took all of their classes online.
At the graduate level, 215 students took at least one online class and 1,861 took all classes online. Distance education is available at the undergraduate and graduate levels.
Healthcare Programs at Lindenwood University
The following healthcare majors are available at Lindenwood University, with the number of degrees awarded at each level in the most recent reporting year.
| Program | Bachelor’s | Master’s | Doctorate | Total |
|---|---|---|---|---|
| Mental and Social Health Services and Allied Professions | — | 47 | — | 47 |
| Health and Medical Administrative Services | 12 | 14 | — | 26 |
| Public Health | 19 | — | — | 19 |
| Rehabilitation and Therapeutic Professions | 9 | — | — | 9 |
| Allied Health Diagnostic, Intervention, and Treatment Professions | 5 | — | — | 5 |
| Health Services/Allied Health/Health Sciences, General | 4 | — | — | 4 |
Academic Programs at Lindenwood University
Lindenwood University offers 20 distinct academic programs.
The highest level of award offered is Doctor’s degree.
Institutional Profile
Lindenwood University maintains an open admission policy: No. Credit transfer:
- AP credits: Yes
- Dual enrollment credits: Yes
- Life experience credits: Implied no
References
More about our data sources and methodologies.
HealthcareDegreeSearch.com provides higher-education, college and university, degree, program, career, salary, and other helpful information to students, faculty, institutions, and other internet audiences. Presented information and data are subject to change. Inclusion on this website does not imply or represent a direct relationship with the company, school, or brand. Information, though believed correct at time of publication, may not be correct, and no warranty is provided. Contact the schools to verify any information before relying on it. Financial aid may be available for those who qualify. The displayed options may include sponsored or recommended results, not necessarily based on your preferences.
© HealthcareDegreeSearch.com – All Rights Reserved.