Oregon Health & Science University Healthcare Programs
Oregon Health & Science University is a public institution located in Portland, Oregon. The surrounding area of the school is a good match for students who enjoy city life.
Featured schools near , edit
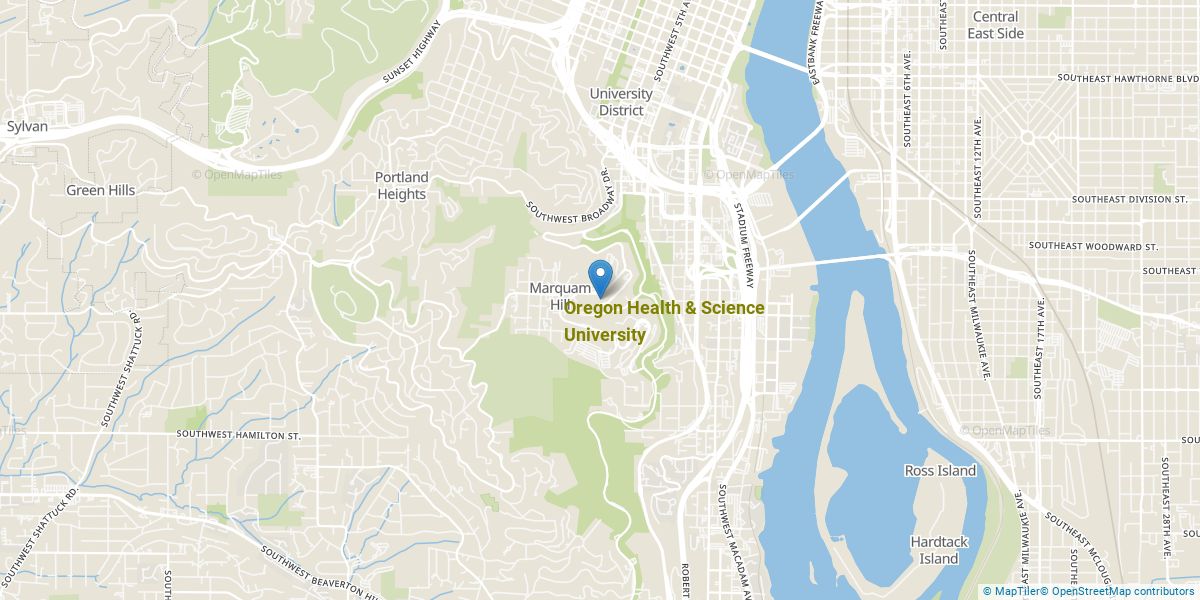
Where Is Oregon Health & Science University?
Contact details for OHSU are given below.
| Contact Details | |
|---|---|
| Address: | 3181 Sw Sam Jackson Park Rd, Portland, OR 97239-3098 |
| Phone: | 503-494-7800 |
| Website: | www.ohsu.edu |
Can I Afford Oregon Health & Science University?
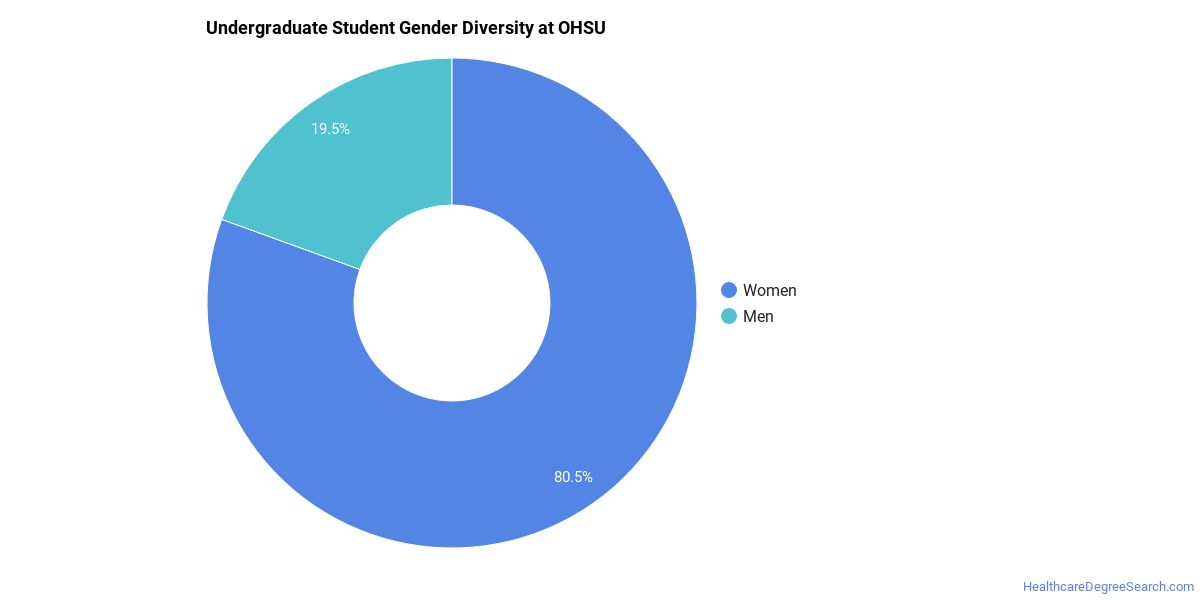
Oregon Health & Science University Undergraduate Student Diversity
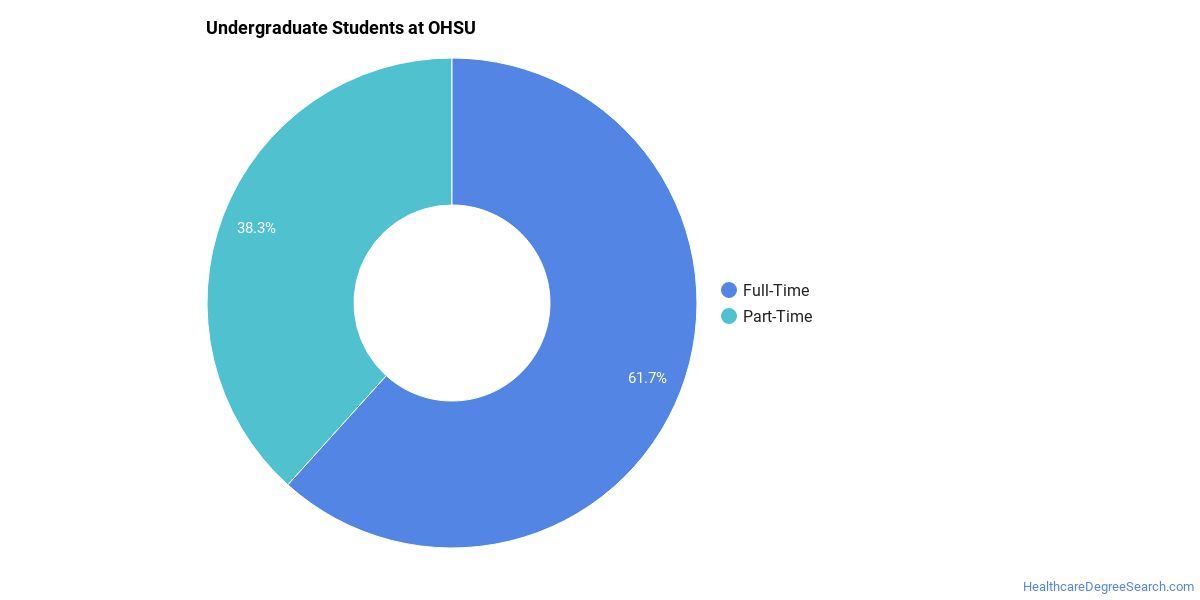
There are also 2,226 graduate students at the school.
Gender Diversity
Of the 329 full-time undergraduates at OHSU, 18% are male and 82% are female.
Racial-Ethnic Diversity
The racial-ethnic breakdown of Oregon Health & Science University students is as follows.
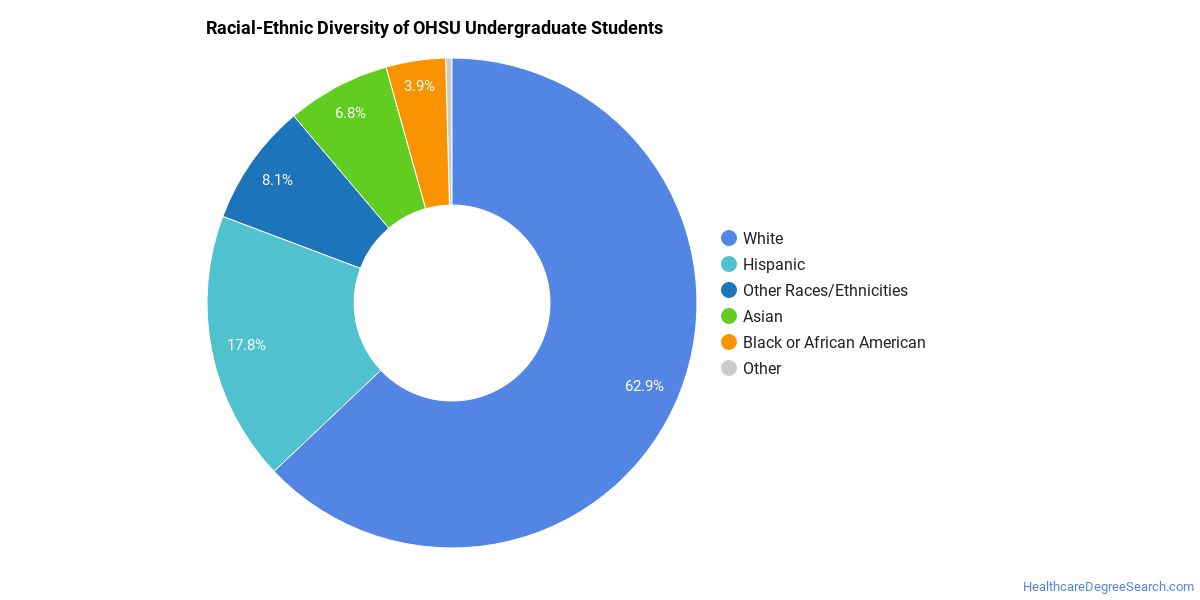
| Race/Ethnicity | Number of Grads |
|---|---|
| Asian | 24 |
| Black or African American | 6 |
| Hispanic or Latino | 58 |
| White | 204 |
| International Students | 3 |
| Other Races/Ethnicities | 34 |
Over 22 countries are represented at OHSU. The most popular countries sending students to the school are China, India, and Iran.
Oregon Health & Science University Healthcare Concentrations
The table below shows the number of awards for each concentration.
| Major | Bachelor’s | Graduate Certificate | Master’s | Doctor’s | TOTAL |
|---|---|---|---|---|---|
| Registered Nursing | 364 | 0 | 0 | 2 | 366 |
| Medicine | 0 | 0 | 0 | 166 | 166 |
| Health Care Management | 0 | 0 | 85 | 0 | 85 |
| Dentistry | 0 | 0 | 0 | 74 | 74 |
| General Public Health | 0 | 0 | 51 | 1 | 52 |
| Physician Assistant | 0 | 0 | 40 | 0 | 40 |
| Medical Scientist | 0 | 12 | 20 | 0 | 32 |
| Medical Informatics | 0 | 12 | 11 | 1 | 24 |
| Nursing Education | 0 | 0 | 16 | 0 | 16 |
| Family Practice Nurse/Nursing | 0 | 0 | 0 | 16 | 16 |
| Psychiatric/Mental Health Nurse/Nursing | 0 | 0 | 0 | 16 | 16 |
| Public Health Education and Promotion | 0 | 0 | 16 | 0 | 16 |
| Dietetics/Dietitian | 0 | 15 | 0 | 0 | 15 |
| Nurse Anesthetist | 0 | 0 | 0 | 13 | 13 |
| Environmental Health | 0 | 0 | 11 | 0 | 11 |
| Critical Care Nursing | 0 | 0 | 0 | 10 | 10 |
| Nurse Midwife/Nursing Midwifery | 0 | 0 | 0 | 10 | 10 |
| Medical Radiologic Technology/Science - Radiation Therapy | 9 | 0 | 0 | 0 | 9 |
| Orthodontics/Orthodontology | 0 | 4 | 4 | 0 | 8 |
| School Nursing | 0 | 0 | 0 | 8 | 8 |
| Health Services Administration | 0 | 0 | 5 | 0 | 5 |
| Periodontics/Periodontology | 0 | 3 | 1 | 0 | 4 |
| Nursing Practice | 0 | 0 | 0 | 4 | 4 |
| Health/Medical Physics | 0 | 0 | 4 | 0 | 4 |
| Endodontics/Endodontology | 0 | 3 | 0 | 0 | 3 |
| TOTAL | 373 | 49 | 264 | 321 | 1,007 |
References
*The racial-ethnic minorities count is calculated by taking the total number of students and subtracting white students, international students, and students whose race/ethnicity was unknown. This number is then divided by the total number of students at the school to obtain the racial-ethnic minorities percentage.
- College Factual
- National Center for Education Statistics
- Image Credit: By M.O. Stevens under License
More about our data sources and methodologies.
HealthcareDegreeSearch.com provides higher-education, college and university, degree, program, career, salary, and other helpful information to students, faculty, institutions, and other internet audiences. Presented information and data are subject to change. Inclusion on this website does not imply or represent a direct relationship with the company, school, or brand. Information, though believed correct at time of publication, may not be correct, and no warranty is provided. Contact the schools to verify any information before relying on it. Financial aid may be available for those who qualify. The displayed options may include sponsored or recommended results, not necessarily based on your preferences.
© HealthcareDegreeSearch.com – All Rights Reserved.