Rehabilitation Professions at Salem State University
If you are interested in studying Rehabilitation Professions, take a look at what Salem State University. Get started with the following essential facts.
Salem State University sits in Salem, MA.
In the most recent year for which we have data, 52 rehabilitation professions degrees were awarded at Salem State University.
Featured schools near , edit
Online Class Availability at Salem State University
Online coursework is an option at Salem State University. Of 6,230 students, 836 (13%) studied exclusively online and 2,702 (43%) took at least some classes online.
Rehabilitation Professions Rankings at Salem State University
Use these rankings to compare Salem State University’s Rehabilitation Professions program against other schools offering the same major.
Bachelor’s-Level Rankings
| Ranking | Scope | Rank |
|---|---|---|
| Best Value | Massachusetts | #4 of 17 |
| Best Value | New England (Region) | #7 of 34 |
| Best Schools (Quality) | Massachusetts | #13 of 18 |
| Best Schools (Quality) | New England (Region) | #24 of 35 |
| Best Value | Nationwide | #169 of 370 |
| Best Schools (Quality) | Nationwide | #242 of 394 |
Master’s-Level Rankings
| Ranking | Scope | Rank |
|---|---|---|
| Best Value | Massachusetts | #4 of 17 |
| Best Value | New England (Region) | #7 of 34 |
| Best Schools (Quality) | Massachusetts | #13 of 18 |
| Best Schools (Quality) | New England (Region) | #24 of 35 |
| Best Value | Nationwide | #169 of 370 |
| Best Schools (Quality) | Nationwide | #242 of 394 |
Earnings for Rehabilitation Professions Graduates from Salem State University
Students who complete Salem State University’s Rehabilitation Professions program earn at the following median levels (per the U.S. Department of Education’s College Scorecard):

| Years After Graduation | Median Earnings |
|---|---|
| 1 year | $61,511 |
| 2 years | $63,005 |
| 3 years | $69,206 |
Student Demographics & Diversity
Take a look at the composition of Rehabilitation Professions graduates at Salem State University, broken down by degree level.
Looking at the program as a whole, Rehabilitation Professions graduates at Salem State University are 90% women (47) and 10% men (5).
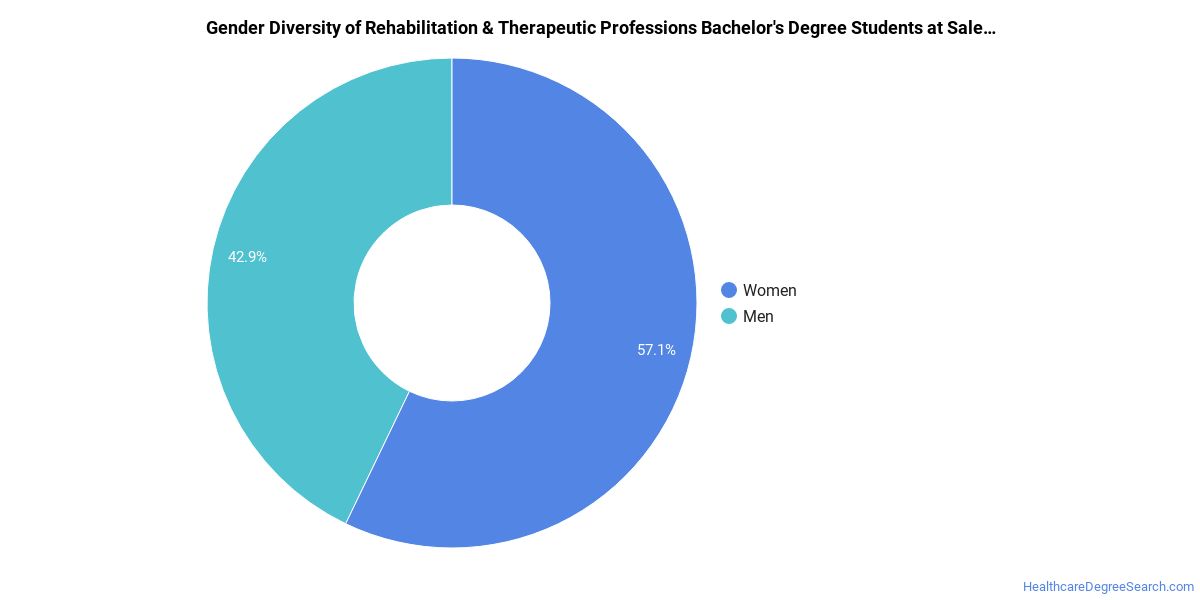
Rehabilitation Professions Bachelor’s Program at Salem State University
Of the 26 bachelor’s rehabilitation professions graduates at Salem State University, 81% were women (21) and 19% were men (5).
The following table and chart show the race/ethnicity of Rehabilitation Professions bachelor’s degree recipients at Salem State University.
| Race / Ethnicity | Number of Graduates |
|---|---|
| White | 17 |
| Hispanic / Latino | 4 |
| Black / African American | 4 |
| International (Nonresident) | 1 |

Racial-ethnic minorities make up 31% of Rehabilitation Professions bachelor’s degree recipients at Salem State University, lower than the national average of 34%.*
Rehabilitation Professions Master’s Program at Salem State University
Of the 26 master’s rehabilitation professions graduates at Salem State University, 100% were women (26) and 0% were men (0).

The following table and chart show the race/ethnicity of Rehabilitation Professions master’s degree recipients at Salem State University.
| Race / Ethnicity | Number of Graduates |
|---|---|
| White | 20 |
| Hispanic / Latino | 4 |
| Two or More Races | 1 |
| Unknown | 1 |

Racial-ethnic minorities make up 19% of Rehabilitation Professions master’s degree recipients at Salem State University, lower than the national average of 28%.*
*The racial-ethnic minorities figure is the total number of graduates minus White, international (nonresident), and unknown-race graduates.
More Specific Rehabilitation Professions Concentrations at Salem State University
The Rehabilitation Professions program at Salem State University offers more specialized concentrations:
| Concentration | Graduates |
|---|---|
| Occupational Therapy | 35 |
| Other Rehabilitation Professions | 17 |
Top-Paying Careers for Rehabilitation Professions Graduates
Those who complete Rehabilitation Professions program at Salem State University work across a variety of fields. Below are the best-paid careers for Rehabilitation Professions majors, ordered by median annual salary:
| Occupation | Nationwide Median Wage |
|---|---|
| Recreational Therapists | $150,116 |
| Exercise Physiologists | $144,072 |
| Physical Therapists | $144,047 |
| Engineers, All Other | $136,628 |
| Low Vision Therapists, Orientation and Mobility Specialists, and Vision Rehabilitation Therapists | $124,839 |
| Therapists, All Other | $121,750 |
| Solar Energy Systems Engineers | $116,775 |
| Mechatronics Engineers | $115,569 |
| Microsystems Engineers | $104,558 |
| Wind Energy Engineers | $98,460 |
References
- IPEDS — Integrated Postsecondary Education Data System
- U.S. Department of Education — College Scorecard
- O*NET Online (Bureau of Labor Statistics)
- National Center for Education Statistics
More about our data sources and methodologies.
HealthcareDegreeSearch.com provides higher-education, college and university, degree, program, career, salary, and other helpful information to students, faculty, institutions, and other internet audiences. Presented information and data are subject to change. Inclusion on this website does not imply or represent a direct relationship with the company, school, or brand. Information, though believed correct at time of publication, may not be correct, and no warranty is provided. Contact the schools to verify any information before relying on it. Financial aid may be available for those who qualify. The displayed options may include sponsored or recommended results, not necessarily based on your preferences.
© HealthcareDegreeSearch.com – All Rights Reserved.