Mental & Social Health Services at San Bernardino Valley College
What traits are you looking for in a school for Mental & Social Health Services, take a look at what San Bernardino Valley College. Get started with the following essential facts.
San Bernardino Valley College is located in San Bernardino, CA.
For the most recent IPEDS reporting year, 132 mental & social health services degrees were granted at San Bernardino Valley College.
Featured schools near , edit
Studying Online at San Bernardino Valley College
Many students take online classes at San Bernardino Valley College. Among 14,055 students, 5,737 (41%) were enrolled entirely in distance education and 4,140 (29%) took at least some classes online.
Mental & Social Health Services Rankings at San Bernardino Valley College
Rankings can help you compare San Bernardino Valley College’s Mental & Social Health Services program against peer institutions.
Associate-Level Rankings
| Ranking | Scope | Rank |
|---|---|---|
| Best Value | California | #15 of 39 |
| Best Value | Far Western (Region) | #25 of 71 |
| Best Schools (Quality) | California | #29 of 48 |
| Best Schools (Quality) | Far Western (Region) | #51 of 82 |
| Best Value | Nationwide | #116 of 514 |
| Best Schools (Quality) | Nationwide | #260 of 530 |
Earnings for Mental & Social Health Services Graduates from San Bernardino Valley College
Students who complete San Bernardino Valley College’s Mental & Social Health Services program earn at the following median levels (per the U.S. Department of Education’s College Scorecard):

| Years After Graduation | Median Earnings |
|---|---|
| 1 year | $61,797 |
| 2 years | $76,460 |
| 4 years | $70,512 |
| 5 years | $72,030 |
How does this compare to the school overall? At the four-year mark, Mental & Social Health Services graduates from San Bernardino Valley College report median earnings of $70,512, compared with $36,171 for all San Bernardino Valley College graduates — about 95% higher than the school-wide median.

Student Demographics & Diversity
Take a look at the composition of Mental & Social Health Services graduates at San Bernardino Valley College, broken down by degree level.
Looking at the program as a whole, Mental & Social Health Services graduates at San Bernardino Valley College are 61% women (81) and 39% men (51).
Mental & Social Health Services Associate’s Program at San Bernardino Valley College
Among the 36 associate’s mental & social health services degrees awarded at San Bernardino Valley College, 58% were women (21) and 42% were men (15).

The following table and chart show the race/ethnicity of Mental & Social Health Services associate’s degree recipients at San Bernardino Valley College.
| Race / Ethnicity | Number of Graduates |
|---|---|
| White | 1 |
| Hispanic / Latino | 15 |
| Black / African American | 7 |
| Asian | 10 |
| Native Hawaiian / Pacific Islander | 1 |
| Two or More Races | 2 |
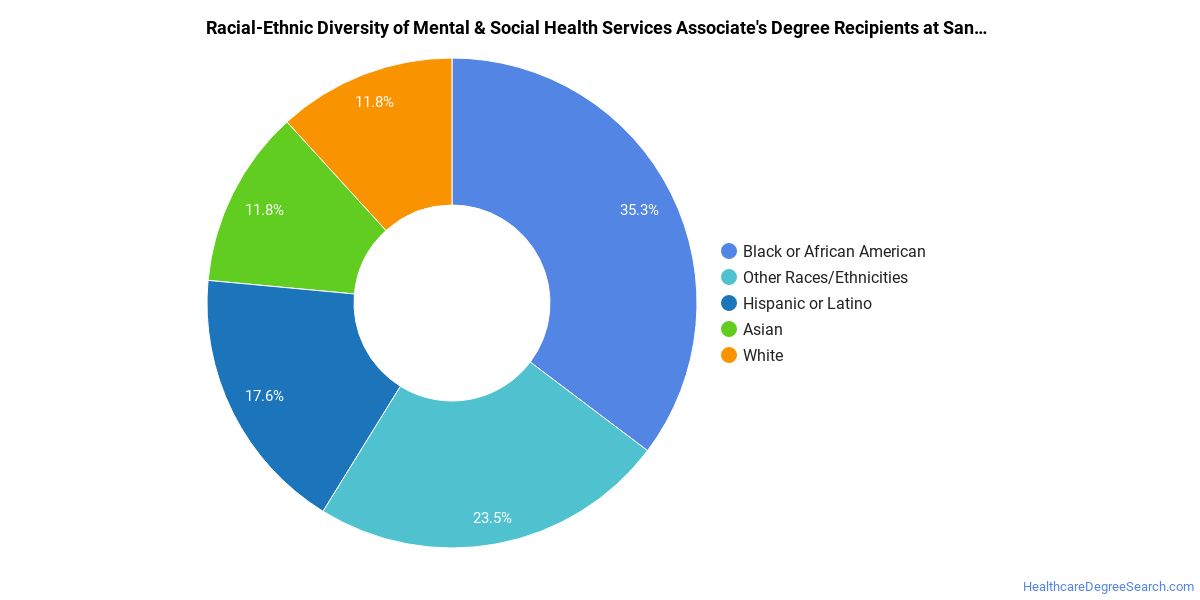
Racial-ethnic minorities make up 97% of Mental & Social Health Services associate’s degree recipients at San Bernardino Valley College, above the national average of 48%.*
*The racial-ethnic minorities figure is the total number of graduates minus White, international (nonresident), and unknown-race graduates.
More Specific Mental & Social Health Services Concentrations at San Bernardino Valley College
This Mental & Social Health Services program at San Bernardino Valley College offers more specialized concentrations:
| Concentration | Graduates |
|---|---|
| Substance Abuse/Addiction Counseling | 26 |
| Mental Health Services Technician | 106 |
Best-Paid Careers for Mental & Social Health Services Graduates
Graduates of the Mental & Social Health Services program at San Bernardino Valley College go on to a range of careers. The table below ranks the top-paying careers for Mental & Social Health Services graduates, ordered by median annual salary:
| Occupation | Nationwide Median Wage |
|---|---|
| Psychology Teachers, Postsecondary | $98,479 |
| Counselors, All Other | $81,766 |
| Health Education Specialists | $81,726 |
| Healthcare Social Workers | $78,044 |
| Marriage and Family Therapists | $74,325 |
| Community Health Workers | $73,901 |
| Mental Health Counselors | $72,983 |
| Social Work Teachers, Postsecondary | $65,510 |
| Genetic Counselors | $58,726 |
| Mental Health and Substance Abuse Social Workers | $58,560 |
References
- IPEDS — Integrated Postsecondary Education Data System
- U.S. Department of Education — College Scorecard
- O*NET Online (Bureau of Labor Statistics)
- National Center for Education Statistics
More about our data sources and methodologies.
HealthcareDegreeSearch.com provides higher-education, college and university, degree, program, career, salary, and other helpful information to students, faculty, institutions, and other internet audiences. Presented information and data are subject to change. Inclusion on this website does not imply or represent a direct relationship with the company, school, or brand. Information, though believed correct at time of publication, may not be correct, and no warranty is provided. Contact the schools to verify any information before relying on it. Financial aid may be available for those who qualify. The displayed options may include sponsored or recommended results, not necessarily based on your preferences.
© HealthcareDegreeSearch.com – All Rights Reserved.