Health & Medical Administrative Services at St Louis College of Health Careers-Fenton
SLCHC is located in Fenton, Missouri and approximately 520 students attend the school each year. In the 2020-2021 academic year, 24 students received a bachelor's degree in health and medical administrative services from SLCHC.
Want to know more about the career opportunities in this field? Check out the Careers in Health & Medical Administrative Services section at the bottom of this page.
SLCHC Health & Medical Administrative Services Degrees Available
- Associate’s Degree in Health & Medical Administrative Services
- Bachelor’s Degree in Health & Medical Administrative Services
- Master’s Degree in Health & Medical Administrative Services
Online Classes Are Available at SLCHC
If you are a working student or have a busy schedule, you may want to consider taking online classes. While these classes used to be mostly populated by returning adults, more and more traditional students are turning to this option.
SLCHC does offer online education options in health and medical administrative services for the following degree levels for those interested in distance learning:
- Associate’s Degree
- Bachelor’s Degree
- Master’s Degree
SLCHC Health & Medical Administrative Services Rankings
The following rankings from College Factual show how the health and medical administrative services progam at SLCHC compares to programs at other colleges and universities.
Note: Rankings don't always give a complete picture of a school's strengths and weaknesses, so it's a good idea to extend your research and also look at other factors when trying to decide if the school is right for you.
Bachelor’s Degree Overall Quality & Other Notable Rankings
The health and medical administrative services major at SLCHC is not ranked on College Factual’s Best Colleges and Universities for Health & Medical Administrative Services. This could be for a number of reasons, such as not having enough data on the major or school to make an accurate assessment of its quality.
| Ranking Type | Rank |
|---|---|
| Most Focused Health/Medical Admin Services Bachelor’s Degree Schools | 13 |
| Most Focused Health/Medical Admin Services Associate Degree Schools | 21 |
| Most Popular Online Health/Medical Admin Services Associate Degree Schools | 34 |
| Most Popular Health/Medical Admin Services Associate Degree Schools | 60 |
| Most Focused Health/Medical Admin Services Schools | 60 |
| Most Popular Online Health/Medical Admin Services Bachelor’s Degree Schools | 69 |
| Most Popular Online Health/Medical Admin Services Schools | 97 |
| Best Health/Medical Admin Services Associate Degree Schools | 114 |
| 152 | |
| Best Health/Medical Admin Services Bachelor’s Degree Schools | 160 |
| Most Popular Health/Medical Admin Services Bachelor’s Degree Schools | 163 |
| 165 | |
| Most Focused Health/Medical Admin Services Master’s Degree Schools | 190 |
| Most Popular Health/Medical Admin Services Schools | 272 |
| Best Health/Medical Admin Services Master’s Degree Schools | 284 |
| Most Popular Health/Medical Admin Services Master’s Degree Schools | 338 |
| Best Value Health/Medical Admin Services Master’s Degree Schools | 346 |
| Best Value Health/Medical Admin Services Bachelor’s Degree Schools | 420 |
| Best Health/Medical Admin Services Schools | 428 |
| 454 | |
| Best Value Health/Medical Admin Services Associate Degree Schools | 570 |
| 900 | |
| Best Value Health/Medical Admin Services Schools | 1,264 |
In 2021, 2 students received their master’s degree in health and medical administrative services from SLCHC. This makes it the #339 most popular school for health and medical administrative services master’s degree candidates in the country.
Health & Medical Administrative Services Student Demographics at SLCHC
Take a look at the following statistics related to the make-up of the health and medical administrative services majors at St Louis College of Health Careers-Fenton.
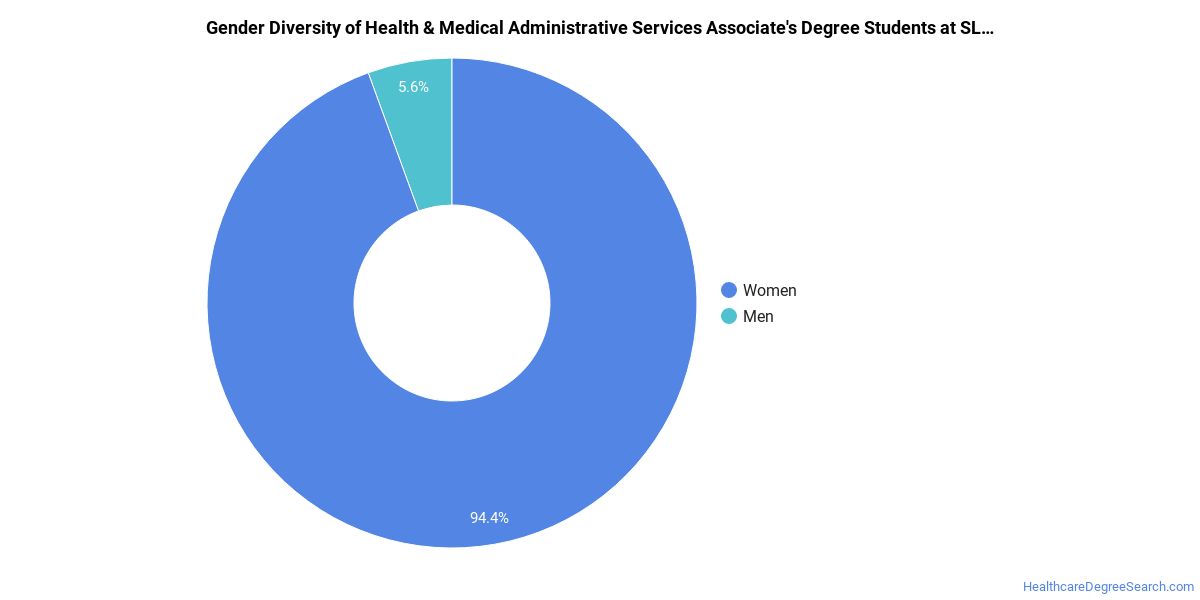
SLCHC Health & Medical Administrative Services Associate’s Program
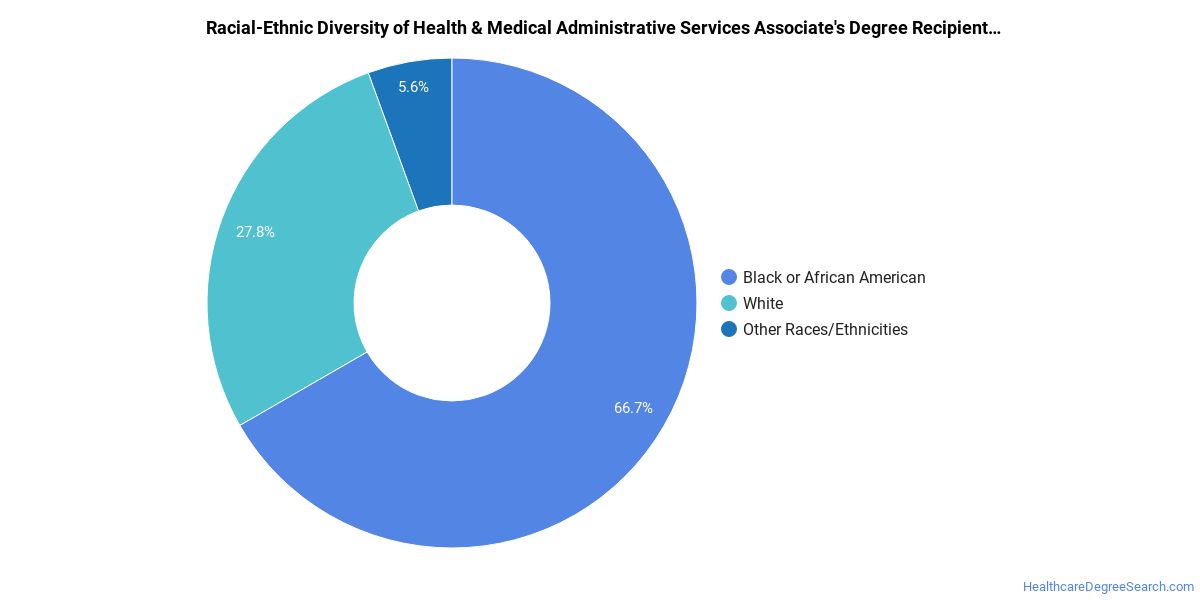
SLCHC does a better job with serving racial-ethnic minorities than the typical school does. Its associate's program in health and medical administrative services graduates 22% more racial-ethnic minorities than the nationwide average.*
The following table and chart show the race/ethnicity for students who recently graduated from St Louis College of Health Careers-Fenton with a associate's in health and medical administrative services.
| Race/Ethnicity | Number of Students |
|---|---|
| Asian | 0 |
| Black or African American | 24 |
| Hispanic or Latino | 0 |
| White | 10 |
| International Students | 0 |
| Other Races/Ethnicities | 2 |
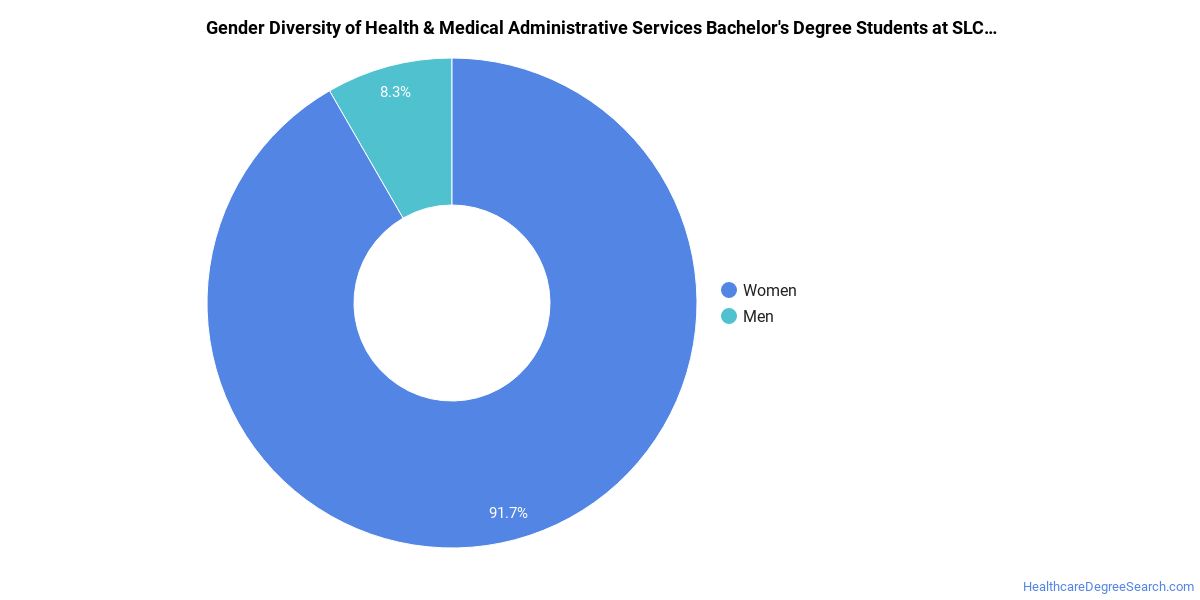
SLCHC Health & Medical Administrative Services Bachelor’s Program
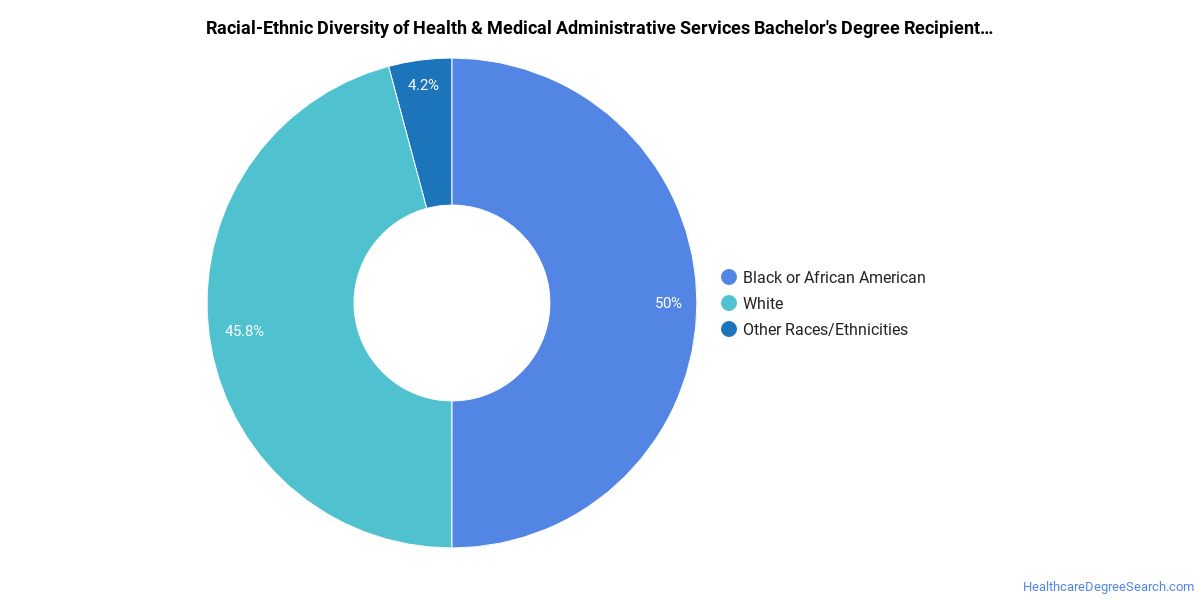
Prospective students may be interested in knowing that this school graduates 2% more racial-ethnic minorities in its health and medical administrative services bachelor's program than the national average.*
The following table and chart show the race/ethnicity for students who recently graduated from St Louis College of Health Careers-Fenton with a bachelor's in health and medical administrative services.
| Race/Ethnicity | Number of Students |
|---|---|
| Asian | 0 |
| Black or African American | 12 |
| Hispanic or Latino | 0 |
| White | 11 |
| International Students | 0 |
| Other Races/Ethnicities | 1 |
SLCHC Health & Medical Administrative Services Master’s Program

In the health and medical administrative services master's program at this school, racial-ethnic minorities make up 100% of degree recipients. That is 52% better than the national average.*
The following table and chart show the race/ethnicity for students who recently graduated from St Louis College of Health Careers-Fenton with a master's in health and medical administrative services.
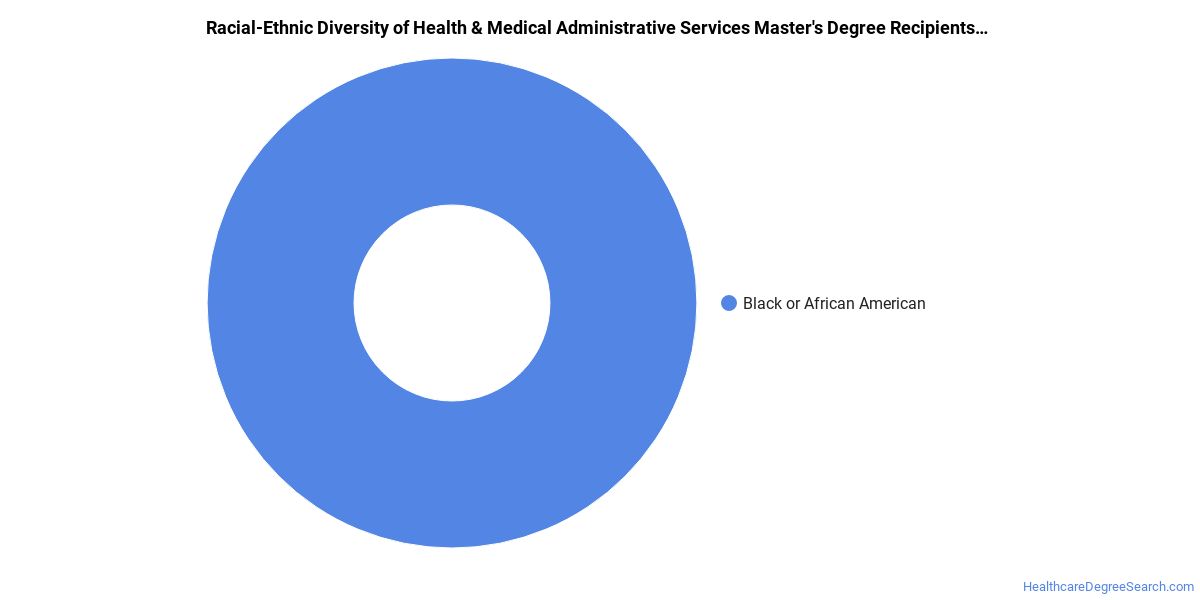
| Race/Ethnicity | Number of Students |
|---|---|
| Asian | 0 |
| Black or African American | 2 |
| Hispanic or Latino | 0 |
| White | 0 |
| International Students | 0 |
| Other Races/Ethnicities | 0 |
SLCHC also has a doctoral program available in health and medical administrative services. In 2021, 0 student graduated with a doctor's degree in this field.
Concentrations Within Health & Medical Administrative Services
If you plan to be a health and medical administrative services major, you may want to focus your studies on one of the following concentrations. The completion numbers here include all graduates who receive any type of degree in this field from St Louis College of Health Careers-Fenton. Some of these focus areas may not be available for your degree level.
| Concentration | Annual Degrees Awarded |
|---|---|
| Health Care Management | 62 |
Related Majors
Careers That Health & Medical Administrative Services Grads May Go Into
A degree in health and medical administrative services can lead to the following careers. Since job numbers and average salaries can vary by geographic location, we have only included the numbers for MO, the home state for St Louis College of Health Careers-Fenton.
| Occupation | Jobs in MO | Average Salary in MO |
|---|---|---|
| Office and Administrative Support Worker Supervisors | 22,150 | $57,800 |
| Medical Secretaries | 16,750 | $34,270 |
| Computer User Support Specialists | 13,140 | $47,600 |
| Medical Assistants | 10,260 | $32,260 |
| Claims Adjusters, Examiners, and Investigators | 7,250 | $66,340 |
References
*The racial-ethnic minorities count is calculated by taking the total number of students and subtracting white students, international students, and students whose race/ethnicity was unknown. This number is then divided by the total number of students at the school to obtain the racial-ethnic minorities percentage.
More about our data sources and methodologies.
HealthcareDegreeSearch.com provides higher-education, college and university, degree, program, career, salary, and other helpful information to students, faculty, institutions, and other internet audiences. Presented information and data are subject to change. Inclusion on this website does not imply or represent a direct relationship with the company, school, or brand. Information, though believed correct at time of publication, may not be correct, and no warranty is provided. Contact the schools to verify any information before relying on it. Financial aid may be available for those who qualify. The displayed options may include sponsored or recommended results, not necessarily based on your preferences.
© HealthcareDegreeSearch.com – All Rights Reserved.