Stanbridge University Healthcare Programs
Stanbridge University is a private for-profit institution located in Irvine, California. The location of the school is great for students who enjoy the amenities of city life.
Featured schools near , edit
Where Is Stanbridge University?
Contact details for Stanbridge are given below.
| Contact Details | |
|---|---|
| Address: | 2041 Business Ctr Dr Ste 107, Irvine, CA 92612 |
| Phone: | 949-794-9090 |
| Website: | www.stanbridge.edu |
Admission Requirements for Stanbridge
| Submission | Required? |
|---|---|
| High School GPA | 5 |
| High School Rank | 3 |
| High School Transcript | 1 |
| College Prep Program | 5 |
| Recommendations | 5 |
| SAT or ACT Scores | 3 |
| TOEFL | 3 |
How Hard Is It To Get Into Stanbridge?
Approximately 15% of accepted students are men and 69% are women. The acceptance rate for men is 10%, and the acceptance rate for women is 12%.
Can I Afford Stanbridge University?
Student Loan Debt
It's not uncommon for college students to take out loans to pay for school. In fact, almost 66% of students nationwide depend at least partially on loans. At Stanbridge, approximately 81% of students took out student loans averaging $11,130 a year. That adds up to $44,520 over four years for those students.
Stanbridge University Undergraduate Student Diversity
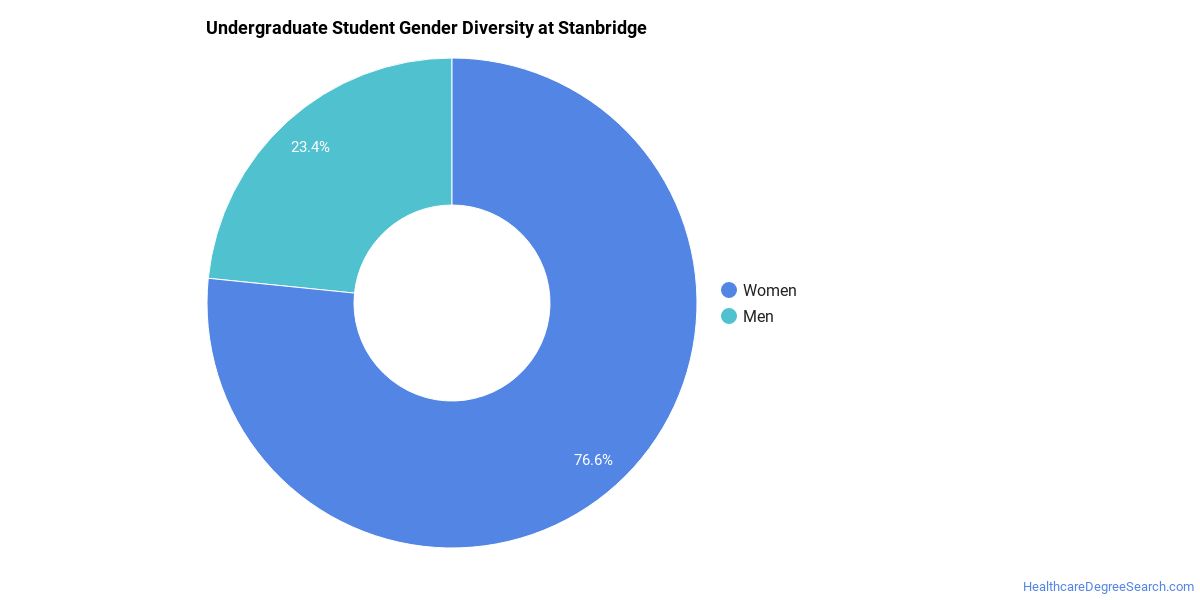
Gender Diversity
Of the 1,508 full-time undergraduates at Stanbridge, 24% are male and 76% are female.
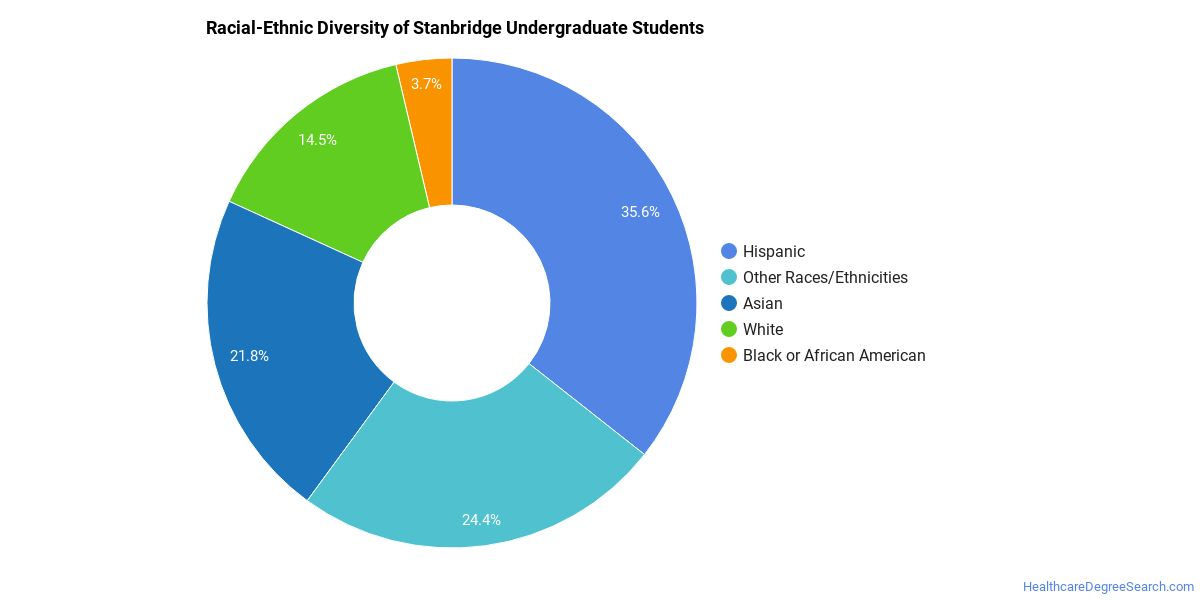
Racial-Ethnic Diversity
The racial-ethnic breakdown of Stanbridge University students is as follows.
| Race/Ethnicity | Number of Grads |
|---|---|
| Asian | 321 |
| Black or African American | 54 |
| Hispanic or Latino | 550 |
| White | 270 |
| International Students | 0 |
| Other Races/Ethnicities | 313 |
Stanbridge University Healthcare Concentrations
The table below shows the number of awards for each concentration.
| Major | Associate’s | Undergraduate Certificate | Bachelor’s | Master’s | TOTAL |
|---|---|---|---|---|---|
| Licensed Practical/Vocational Nurse Training | 0 | 235 | 0 | 0 | 235 |
| Registered Nursing | 128 | 0 | 7 | 0 | 135 |
| Occupational Therapist Assistant | 93 | 0 | 0 | 0 | 93 |
| Physical Therapy Assistant | 82 | 0 | 0 | 0 | 82 |
| Occupational Therapy | 0 | 0 | 0 | 63 | 63 |
| Health Care Management | 0 | 0 | 7 | 0 | 7 |
| TOTAL | 303 | 235 | 14 | 63 | 615 |
References
*The racial-ethnic minorities count is calculated by taking the total number of students and subtracting white students, international students, and students whose race/ethnicity was unknown. This number is then divided by the total number of students at the school to obtain the racial-ethnic minorities percentage.
More about our data sources and methodologies.
HealthcareDegreeSearch.com provides higher-education, college and university, degree, program, career, salary, and other helpful information to students, faculty, institutions, and other internet audiences. Presented information and data are subject to change. Inclusion on this website does not imply or represent a direct relationship with the company, school, or brand. Information, though believed correct at time of publication, may not be correct, and no warranty is provided. Contact the schools to verify any information before relying on it. Financial aid may be available for those who qualify. The displayed options may include sponsored or recommended results, not necessarily based on your preferences.
© HealthcareDegreeSearch.com – All Rights Reserved.