Texas A & M University - Central Texas Healthcare Programs
Texas A & M University - Central Texas is a public institution located in Killeen, Texas. Students who love country life may enjoy the rural location of Texas A & M University - Central Texas.
Featured schools near , edit
Where Is Texas A & M University - Central Texas?
Contact details for Texas A & M University - Central Texas are given below.
| Contact Details | |
|---|---|
| Address: | 1001 Leadership Place, Killeen, TX 76549 |
| Phone: | 254-519-5400 |
| Website: | tamuct.edu |
| Facebook: | http://www.facebook.com/tamuct |
| Twitter: | http://www.twitter.com/tamuct |
How Do I Get Into Texas A & M University - Central Texas?
You can apply to Texas A & M University - Central Texas online at: https://www.applytexas.org/adappc/gen/c_start.WBX
Admission Requirements for Texas A & M University - Central Texas
| Submission | Required? |
|---|---|
| High School GPA | 3 |
| High School Rank | 3 |
| High School Transcript | 3 |
| College Prep Program | 3 |
| Recommendations | 3 |
| SAT or ACT Scores | 3 |
| TOEFL | 1 |
How Hard Is It To Get Into Texas A & M University - Central Texas?
Approximately 36% of accepted students are men and 64% are women. The acceptance rate for men is 92%, and the acceptance rate for women is 98%.
Can I Afford Texas A & M University - Central Texas?
Texas A & M University - Central Texas Undergraduate Student Diversity
There are also 453 graduate students at the school.
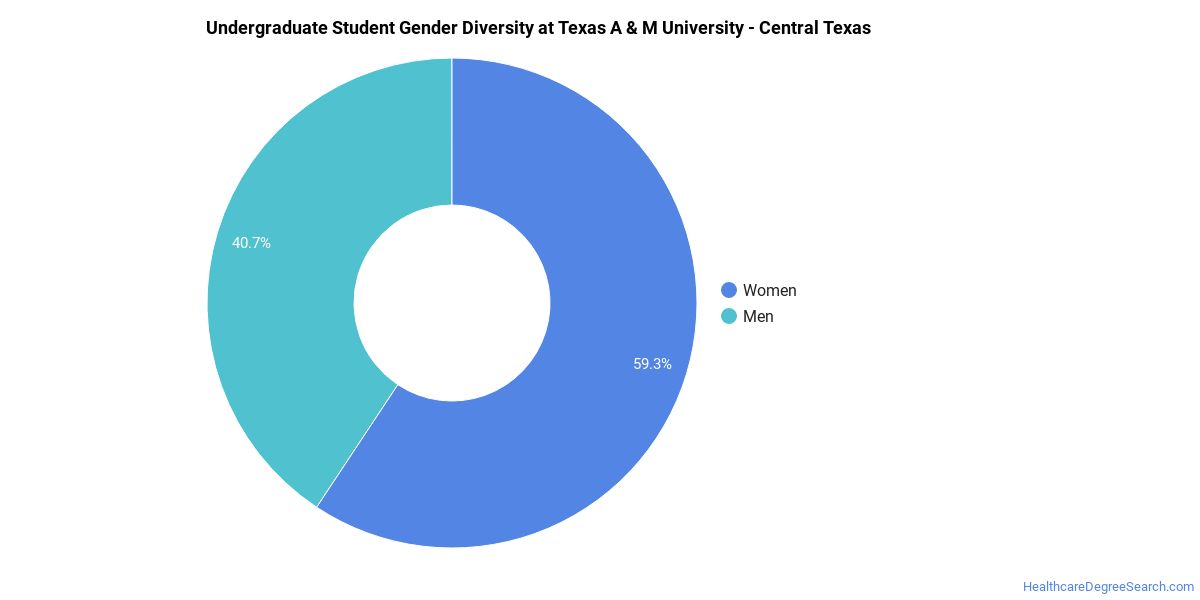
Gender Diversity
Of the 731 full-time undergraduates at Texas A & M University - Central Texas, 41% are male and 59% are female.
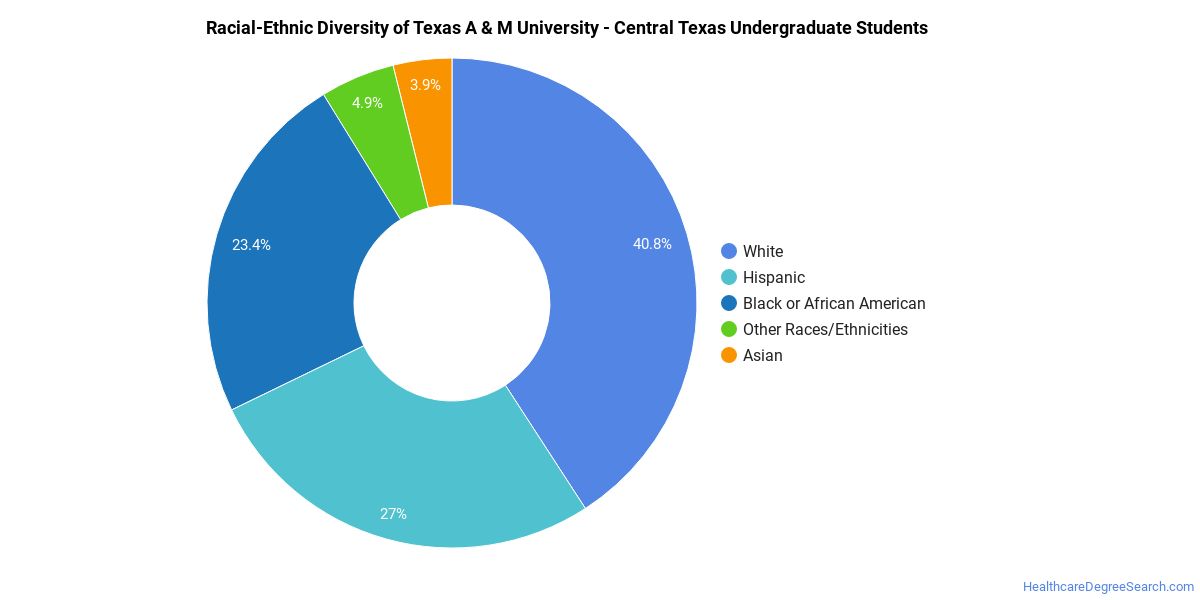
Racial-Ethnic Diversity
The racial-ethnic breakdown of Texas A & M University - Central Texas students is as follows.
| Race/Ethnicity | Number of Grads |
|---|---|
| Asian | 20 |
| Black or African American | 170 |
| Hispanic or Latino | 213 |
| White | 282 |
| International Students | 1 |
| Other Races/Ethnicities | 45 |
Texas A & M University - Central Texas Healthcare Concentrations
The table below shows the number of awards for each concentration.
| Major | Bachelor’s | Master’s | TOTAL |
|---|---|---|---|
| Registered Nursing | 23 | 0 | 23 |
| Marriage and Family Therapy/Counseling | 0 | 11 | 11 |
| Mental Health Counseling/Counselor | 0 | 11 | 11 |
| TOTAL | 23 | 22 | 45 |
References
*The racial-ethnic minorities count is calculated by taking the total number of students and subtracting white students, international students, and students whose race/ethnicity was unknown. This number is then divided by the total number of students at the school to obtain the racial-ethnic minorities percentage.
More about our data sources and methodologies.
HealthcareDegreeSearch.com provides higher-education, college and university, degree, program, career, salary, and other helpful information to students, faculty, institutions, and other internet audiences. Presented information and data are subject to change. Inclusion on this website does not imply or represent a direct relationship with the company, school, or brand. Information, though believed correct at time of publication, may not be correct, and no warranty is provided. Contact the schools to verify any information before relying on it. Financial aid may be available for those who qualify. The displayed options may include sponsored or recommended results, not necessarily based on your preferences.
© HealthcareDegreeSearch.com – All Rights Reserved.