Rehabilitation & Therapeutic Professions at Texas Tech University Health Sciences Center
Every rehabilitation and therapeutic professions school has its own distinct culture and strengths. We've pulled together some statistics and other details to help you see how the rehabilitation program at Texas Tech University Health Sciences Center stacks up to those at other schools.TTUHSC is located in Lubbock, Texas and has a total student population of 5,274.
Want to know more about the career opportunities in this field? Check out the Careers in Rehabilitation & Therapeutic Professions section at the bottom of this page.
TTUHSC Rehabilitation & Therapeutic Professions Degrees Available
- Master’s Degree in Rehabilitation
- Doctorate Degree in Rehabilitation
Online Classes Are Available at TTUHSC
If you are a working student or have a busy schedule, you may want to consider taking online classes. While these classes used to be mostly populated by returning adults, more and more traditional students are turning to this option.
Are you one of the many who prefer to take online classes? TTUHSC offers distance education options for rehabilitation at the following degree levels:
- Master’s Degree
TTUHSC Rehabilitation & Therapeutic Professions Rankings
Note: Rankings don't always give a complete picture of a school's strengths and weaknesses, so it's a good idea to extend your research and also look at other factors when trying to decide if the school is right for you.
There were 94 students who received their doctoral degrees in rehabilitation, making the school the #30 most popular school in the United States for this category of students.
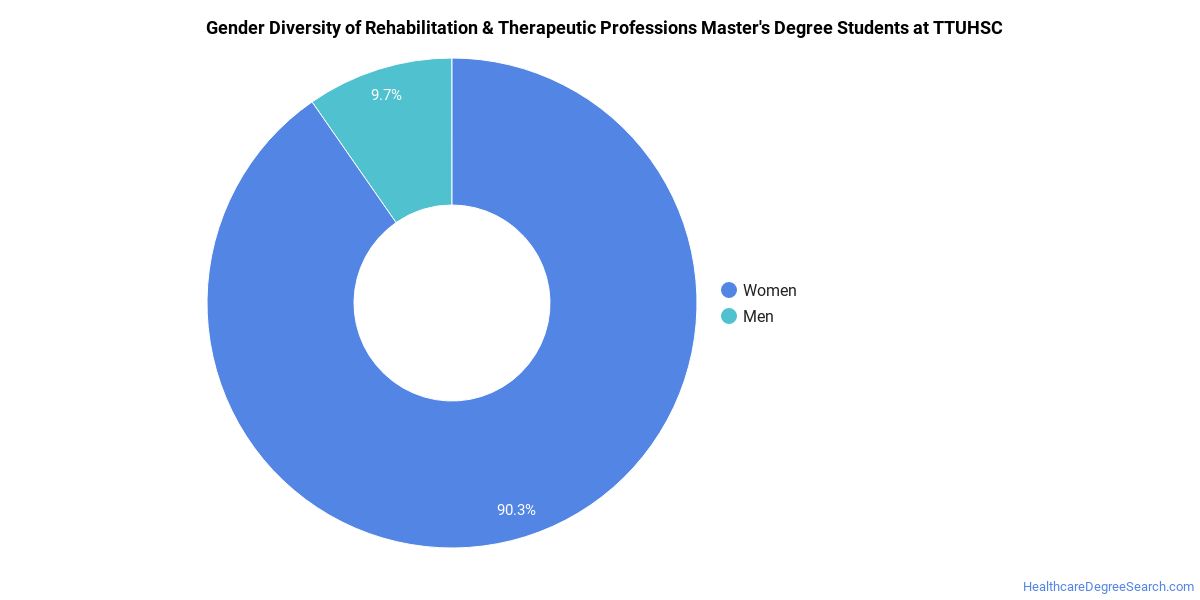
Rehabilitation Student Demographics at TTUHSC
Take a look at the following statistics related to the make-up of the rehabilitation majors at Texas Tech University Health Sciences Center.
TTUHSC Rehabilitation & Therapeutic Professions Master’s Program
Of the students who received a rehabilitation master's degree from TTUHSC, 68% were white. This is typical for this degree on the natiowide level. In the rehabilitation master's program at this school, racial-ethnic minorities make up 29% of degree recipients. That is 3% better than the national average.*
The following table and chart show the race/ethnicity for students who recently graduated from Texas Tech University Health Sciences Center with a master's in rehabilitation.
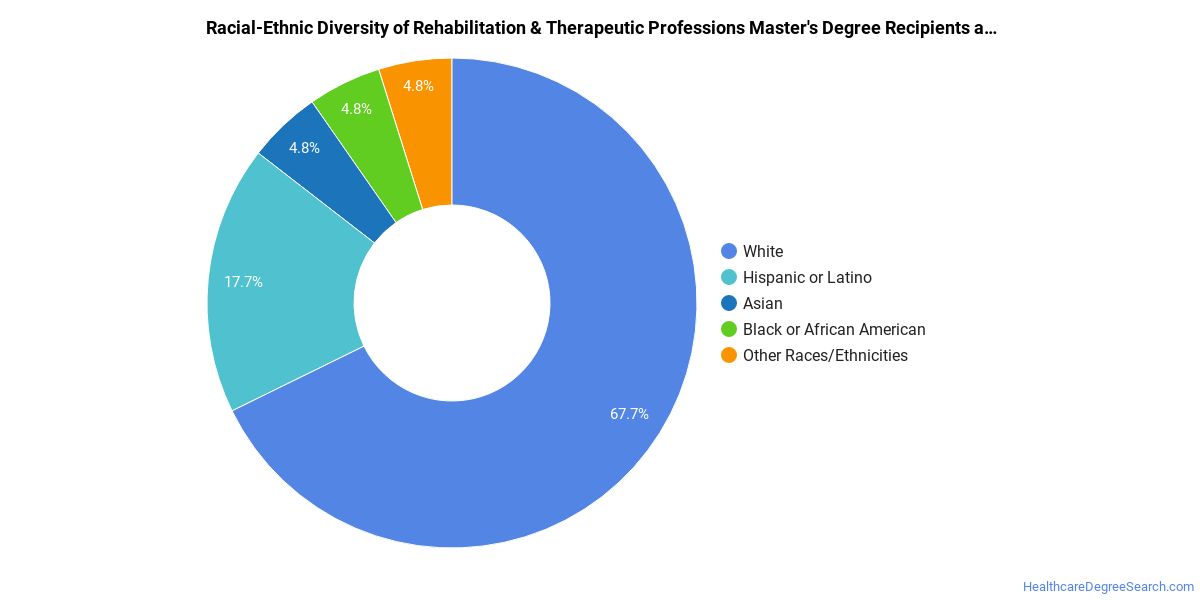
| Race/Ethnicity | Number of Students |
|---|---|
| Asian | 3 |
| Black or African American | 3 |
| Hispanic or Latino | 11 |
| White | 42 |
| International Students | 0 |
| Other Races/Ethnicities | 3 |
Concentrations Within Rehabilitation & Therapeutic Professions
If you plan to be a rehabilitation major, you may want to focus your studies on one of the following concentrations. The completion numbers here include all graduates who receive any type of degree in this field from Texas Tech University Health Sciences Center. Some of these focus areas may not be available for your degree level.
| Concentration | Annual Degrees Awarded |
|---|---|
| Physical Therapy/Therapist | 92 |
| Occupational Therapy | 52 |
| Vocational Rehabilitation Counseling | 10 |
| Rehabilitation Science | 2 |
Related Majors
- Medical Illustration & Informatics
- Bioethics/Medical Ethics
- Mental & Social Health Services
- Public Health
- Clinical/Medical Laboratory Science
Careers That Rehabilitation Grads May Go Into
A degree in rehabilitation can lead to the following careers. Since job numbers and average salaries can vary by geographic location, we have only included the numbers for TX, the home state for Texas Tech University Health Sciences Center.
| Occupation | Jobs in TX | Average Salary in TX |
|---|---|---|
| Physical Therapists | 16,120 | $92,940 |
| Health Specialties Professors | 13,930 | $139,540 |
| Engineers | 10,710 | $113,370 |
| Occupational Therapists | 9,250 | $89,360 |
| Rehabilitation Counselors | 3,270 | $44,910 |
References
*The racial-ethnic minorities count is calculated by taking the total number of students and subtracting white students, international students, and students whose race/ethnicity was unknown. This number is then divided by the total number of students at the school to obtain the racial-ethnic minorities percentage.
- College Factual
- National Center for Education Statistics
- O*NET Online
- Image Credit: By Krista Mericle under License
More about our data sources and methodologies.
HealthcareDegreeSearch.com provides higher-education, college and university, degree, program, career, salary, and other helpful information to students, faculty, institutions, and other internet audiences. Presented information and data are subject to change. Inclusion on this website does not imply or represent a direct relationship with the company, school, or brand. Information, though believed correct at time of publication, may not be correct, and no warranty is provided. Contact the schools to verify any information before relying on it. Financial aid may be available for those who qualify. The displayed options may include sponsored or recommended results, not necessarily based on your preferences.
© HealthcareDegreeSearch.com – All Rights Reserved.