General Public Health at University of Cincinnati-Main Campus
If you plan to study General Public Health, consider the program at University of Cincinnati-Main Campus. We’ve gathered the following information to help you decide.
University of Cincinnati-Main Campus sits in Cincinnati, OH.
In the most recent year for which we have data, 44 general public health degrees were granted at University of Cincinnati-Main Campus.
Featured schools near , edit
Studying Online at University of Cincinnati-Main Campus
Online coursework is an option at University of Cincinnati-Main Campus. Among 45,026 students, 9,022 (20%) were enrolled entirely in distance education and 19,145 (43%) took at least some classes online.
General Public Health Rankings at University of Cincinnati-Main Campus
These rankings give you a sense of how University of Cincinnati-Main Campus’s General Public Health program against other schools offering the same major.
Master’s-Level Rankings
| Ranking | Scope | Rank |
|---|---|---|
| Best Schools (Quality) | Ohio | #8 of 10 |
| Best Value | Ohio | #8 of 11 |
| Best Schools (Quality) | Great Lakes (Region) | #29 of 34 |
| Best Value | Great Lakes (Region) | #29 of 38 |
| Best Value | Nationwide | #220 of 299 |
| Best Schools (Quality) | Nationwide | #224 of 280 |
Student Demographics & Diversity
Below you’ll find the student demographics for General Public Health graduates at University of Cincinnati-Main Campus, broken down by degree level.
Looking at the program as a whole, General Public Health graduates at University of Cincinnati-Main Campus are 89% women (39) and 11% men (5).
General Public Health Associate’s Program at University of Cincinnati-Main Campus
Among the 4 associate’s general public health graduates at University of Cincinnati-Main Campus, 100% were women (4) and 0% were men (0).

The following table and chart show the race/ethnicity of General Public Health associate’s degree recipients at University of Cincinnati-Main Campus.
| Race / Ethnicity | Number of Graduates |
|---|---|
| White | 3 |
| Two or More Races | 1 |

Racial-ethnic minorities make up 25% of General Public Health associate’s degree recipients at University of Cincinnati-Main Campus, lower than the national average of 30%.*
General Public Health Bachelor’s Program at University of Cincinnati-Main Campus
Among the 32 bachelor’s general public health graduates at University of Cincinnati-Main Campus, 84% were women (27) and 16% were men (5).

The following table and chart show the race/ethnicity of General Public Health bachelor’s degree recipients at University of Cincinnati-Main Campus.
| Race / Ethnicity | Number of Graduates |
|---|---|
| White | 19 |
| Hispanic / Latino | 2 |
| Black / African American | 5 |
| Asian | 3 |
| Two or More Races | 2 |
| International (Nonresident) | 1 |

Minority students account for 38% of General Public Health bachelor’s degree recipients at University of Cincinnati-Main Campus, below the national average of 58%.*
General Public Health Master’s Program at University of Cincinnati-Main Campus
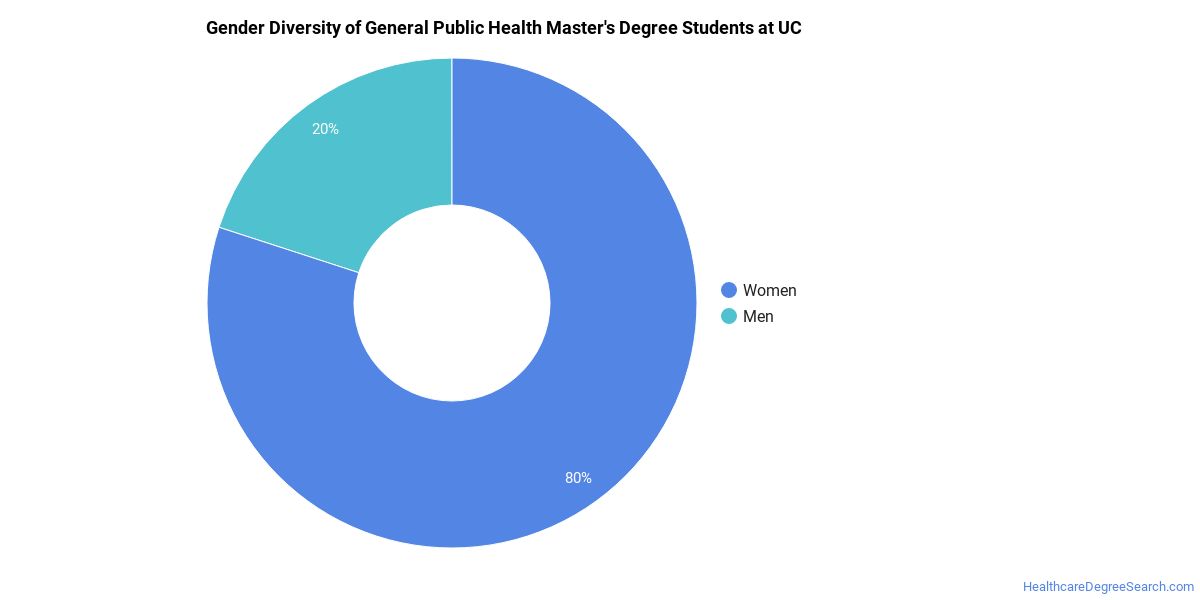
Of the 8 master’s general public health graduates at University of Cincinnati-Main Campus, 100% were women (8) and 0% were men (0).
The following table and chart show the race/ethnicity of General Public Health master’s degree recipients at University of Cincinnati-Main Campus.
| Race / Ethnicity | Number of Graduates |
|---|---|
| White | 5 |
| Black / African American | 2 |
| International (Nonresident) | 1 |
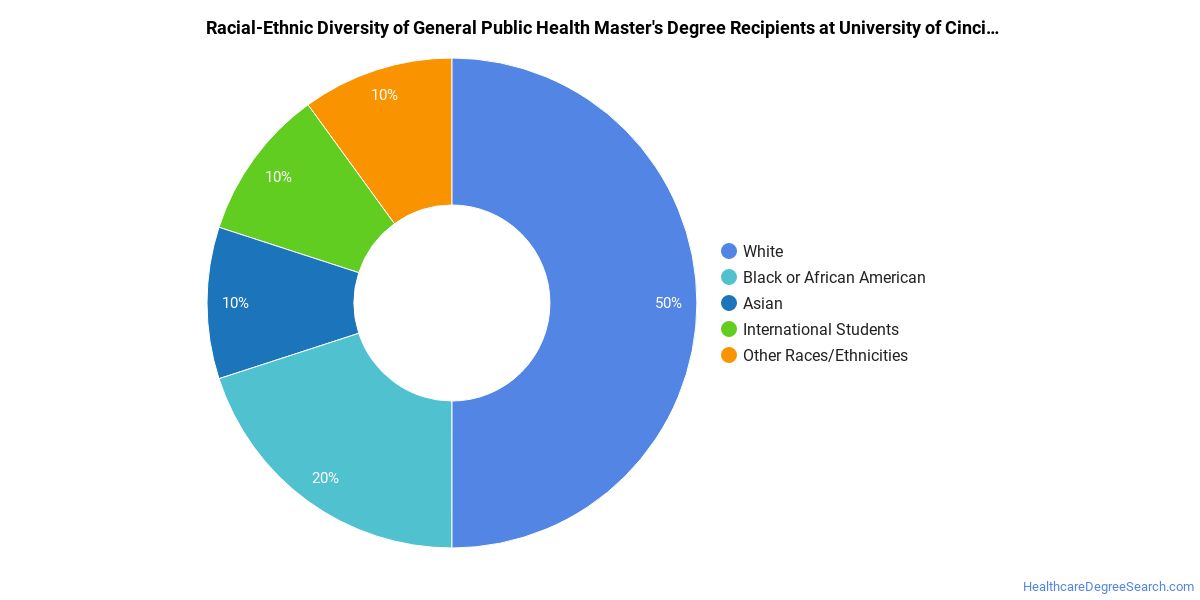
Minority students account for 25% of General Public Health master’s degree recipients at University of Cincinnati-Main Campus, lower than the national average of 49%.*
*The racial-ethnic minorities figure is the total number of graduates minus White, international (nonresident), and unknown-race graduates.
Top-Paying Careers for General Public Health Graduates
Graduates of the General Public Health program at University of Cincinnati-Main Campus work across a variety of fields. Here are the top-paying careers for General Public Health majors, ordered by median annual salary:
| Occupation | Nationwide Median Wage |
|---|---|
| Medical and Health Services Managers | $129,557 |
| Health Education Specialists | $81,726 |
| Community Health Workers | $73,901 |
| Health Specialties Teachers, Postsecondary | $46,663 |
References
- IPEDS — Integrated Postsecondary Education Data System
- U.S. Department of Education — College Scorecard
- O*NET Online (Bureau of Labor Statistics)
- National Center for Education Statistics
More about our data sources and methodologies.
HealthcareDegreeSearch.com provides higher-education, college and university, degree, program, career, salary, and other helpful information to students, faculty, institutions, and other internet audiences. Presented information and data are subject to change. Inclusion on this website does not imply or represent a direct relationship with the company, school, or brand. Information, though believed correct at time of publication, may not be correct, and no warranty is provided. Contact the schools to verify any information before relying on it. Financial aid may be available for those who qualify. The displayed options may include sponsored or recommended results, not necessarily based on your preferences.
© HealthcareDegreeSearch.com – All Rights Reserved.