Mental & Social Health Services at Chippewa Valley Technical College
What traits are you looking for in a school for Mental & Social Health Services, consider the program at Chippewa Valley Technical College. Get started with the following essential facts.
Chippewa Valley Technical College is located in Eau Claire, WI.
In the most recent year for which we have data, 13 mental & social health services degrees were awarded at Chippewa Valley Technical College.
Featured schools near , edit
Online Class Availability at Chippewa Valley Technical College
Distance learning is available at Chippewa Valley Technical College. Among 8,330 students, 1,795 (22%) studied exclusively online and 1,735 (21%) took at least some classes online.
Mental & Social Health Services Rankings at Chippewa Valley Technical College
Use these rankings to compare Chippewa Valley Technical College’s Mental & Social Health Services program to other colleges that offer this major.
Associate-Level Rankings
| Ranking | Scope | Rank |
|---|---|---|
| Best Schools (Quality) | Wisconsin | #9 of 17 |
| Best Value | Wisconsin | #9 of 17 |
| Best Value | Great Lakes (Region) | #26 of 80 |
| Best Schools (Quality) | Great Lakes (Region) | #36 of 81 |
| Best Value | Nationwide | #195 of 514 |
| Best Schools (Quality) | Nationwide | #253 of 530 |
Student Demographics & Diversity
The following sections describe the student demographics for Mental & Social Health Services graduates at Chippewa Valley Technical College, by degree type.
Looking at the program as a whole, Mental & Social Health Services graduates at Chippewa Valley Technical College are 77% women (10) and 23% men (3).
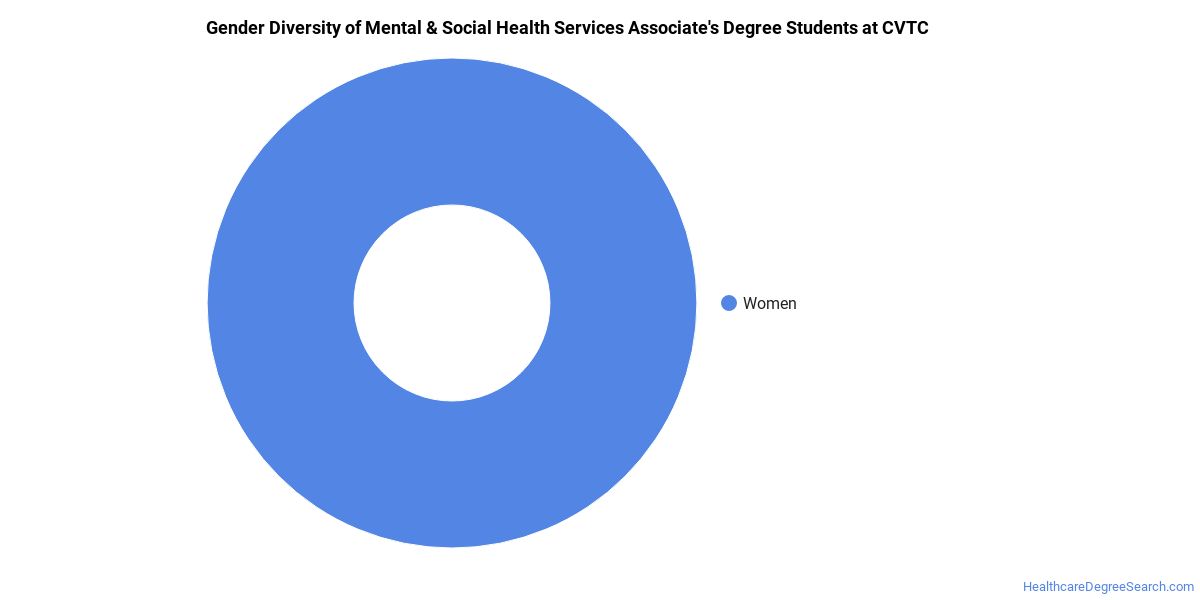
Mental & Social Health Services Associate’s Program at Chippewa Valley Technical College
Among the 13 associate’s mental & social health services graduates at Chippewa Valley Technical College, 77% were women (10) and 23% were men (3).
The following table and chart show the race/ethnicity of Mental & Social Health Services associate’s degree recipients at Chippewa Valley Technical College.
| Race / Ethnicity | Number of Graduates |
|---|---|
| White | 10 |
| Black / African American | 1 |
| Asian | 2 |

Minority students account for 23% of Mental & Social Health Services associate’s degree recipients at Chippewa Valley Technical College, lower than the national average of 48%.*
*The racial-ethnic minorities figure is the total number of graduates minus White, international (nonresident), and unknown-race graduates.
More Specific Mental & Social Health Services Concentrations at Chippewa Valley Technical College
This Mental & Social Health Services program at Chippewa Valley Technical College includes the following sub-specializations:
| Concentration | Graduates |
|---|---|
| Substance Abuse/Addiction Counseling | 11 |
| Community Health Services/Counseling | 2 |
Best-Paid Careers for Mental & Social Health Services Graduates
Students who finish Mental & Social Health Services program at Chippewa Valley Technical College work across a variety of fields. Below are the top-paying careers for Mental & Social Health Services majors, ordered by median annual salary:
| Occupation | Nationwide Median Wage |
|---|---|
| Psychology Teachers, Postsecondary | $98,479 |
| Counselors, All Other | $81,766 |
| Health Education Specialists | $81,726 |
| Healthcare Social Workers | $78,044 |
| Marriage and Family Therapists | $74,325 |
| Community Health Workers | $73,901 |
| Mental Health Counselors | $72,983 |
| Social Work Teachers, Postsecondary | $65,510 |
| Genetic Counselors | $58,726 |
| Mental Health and Substance Abuse Social Workers | $58,560 |
References
- IPEDS — Integrated Postsecondary Education Data System
- U.S. Department of Education — College Scorecard
- O*NET Online (Bureau of Labor Statistics)
- National Center for Education Statistics
More about our data sources and methodologies.
HealthcareDegreeSearch.com provides higher-education, college and university, degree, program, career, salary, and other helpful information to students, faculty, institutions, and other internet audiences. Presented information and data are subject to change. Inclusion on this website does not imply or represent a direct relationship with the company, school, or brand. Information, though believed correct at time of publication, may not be correct, and no warranty is provided. Contact the schools to verify any information before relying on it. Financial aid may be available for those who qualify. The displayed options may include sponsored or recommended results, not necessarily based on your preferences.
© HealthcareDegreeSearch.com – All Rights Reserved.